Archive for August, 2018
Why “Uber for X” startups failed: The supply side is king
Remember all the “Uber for x” startups?
A few years ago a ton of “Uber for x” startups got funded, but very few of them – maybe none? – worked out. It sounds good but ultimately most failed on the supply side. Let’s explore why.
Rideshare has better economics, at the same acquisition cost
Rideshare is special. Acquiring a broad base of labor for driving is expensive, often $300+. But then they can get requests all day. You can work 20 hours and even 50 hours a week if you want. You continually need the driver app to find new customers
Where a lot of “Uber for x” companies fall down – valet parking, car washing, massages, etc – is that demand is often infrequent and there’s spikes at a few points in the day. What’s your supply side supposed to do the rest of the time?
In other words, “Uber for x” cos often have the same cost of acquisition and cost of labor as rideshare, but can’t fill their time with work as smoothly / profitably
Marketplace outcomes are sensitive to unit economics
Rideshare networks are fickle and require a long period of being unit economic negative before they can break even, with enough scale/density. But a lot of “Uber for x” cos can never dig out of that hole, and stay unprofitable forever
This is one of the reasons why I’m bearish on food delivery as a stand-alone business in the long run. Uber can tap into their supply side and augment with food delivery earnings. Pure food companies have to get the same drivers but can’t pay as well
Get new updates, usually once a week – featuring long-form essays with what’s going on in tech.
The key is to go for a different pool of workers
So what kind of “Uber for x” ideas can work? Ultimately the ones that go for a completely different pool of labor. Folks who prefer to work from home. People who don’t live near a city with rideshare. People who don’t own cars. Etc.
If you can find a different pool of labor, they still have the same motivations around flexible schedules and easy earning potential. You can use the same techniques as Uber – simple UX, transparent pricing, etc – and apply them to these marketplace opportunities
In that way, the lessons from “Uber for x” are a subset of best practices you can learn from marketplaces. You need a strong strategy to get the supply/demand flywheel going. A big market with a defensible moat. Fragmentation that can be solved w transparency and aggregation
Don’t emulate – approach from first principles, starting from the workers’ POV
IMHO “Uber for x” cos failed to become a thing because they sought to emulate ridesharing when they should have just approached their particular market from first principles. There’s still a ton of marketplace opportunities out there and am excited to see what people do!
Because all these marketplaces tend towards supply constrained, you should evaluate each opportunity/company from the POV of the supply side. Does it work for them? Can they do it 40 hours/week and stay sticky? When can you pull away subsidies? These are the key questions
The key lesson!
Supply side is 👑.
If you’re interested in more reading about Uber and marketplaces, I collected my favorite 20 links here
First published on Twitter here!
The Power User Curve: The best way to understand your most engaged users
[Today we have an essay on one of the common frameworks we use to analyze investments at Andreessen Horowitz: The Power User Curve. I worked closely with Li Jin, a partner on the investing team, to collect our ideas into this essay which she wrote. You can follow @ljin18 on Twitter for more thoughts. -Andrew]

The importance of power users
Power users drive some of the most successful companies — people who love their product, are highly engaged, and contribute a ton of value to the network. In ecommerce marketplaces it’s power sellers, in ridesharing platforms it’s power riders, and in social networks it’s influencers.
All companies want more power users, but you need to measure them before you can find (and retain) them. While DAU/MAU — dividing daily active users (DAUs) by monthly active users (MAUs or monthly actives) — is a common metric for measuring engagement, it has its shortcomings.
Since companies need a richer and more nuanced way to understand user engagement, we’re going to introduce what we’ll call the “Power User Curve” — also commonly called the activity histogram or the “L30” (coined by the Facebook growth team). It’s a histogram of users’ engagement by the total number of days they were active in a month, from 1 day out of the month to all 30 (or 28, or 31) days. While typically reflecting top-level activity like app opens or logins, it can be customized for whatever action you decide is important to measure for your product.
The Power User Curve has a number of advantages over DAU/MAU:
- It shows if you have a hardcore, engaged segment that’s coming back every day.
- It shows the variability among your users: some are slightly engaged, whereas others are power users. Contrast this with DAU/MAU: it’s a single number and so blurs this variance.
- When mapped to cohorts, Power User Curves let you see if your engagement is getting better over time — which in turn helps assess product launches and performance of other feature changes.
- Power User Curves can be shown for different user actions, not just app opens. This matters if the core activity that matters for your product is deeper in the funnel.
In other words, while the DAU/MAU gives you a single number, the Power User Curve gives entrepreneurs several avenues of analysis to assess their product’s engagement to the most addicted users — in a single snapshot, over time, and also in relation to monetization. This is useful. So how does it work?
The Power User Curve will “smile” when things are good
The shape of the Power User Curve can be left-leaning or smile-like, all of which means different things. Here’s a smile:
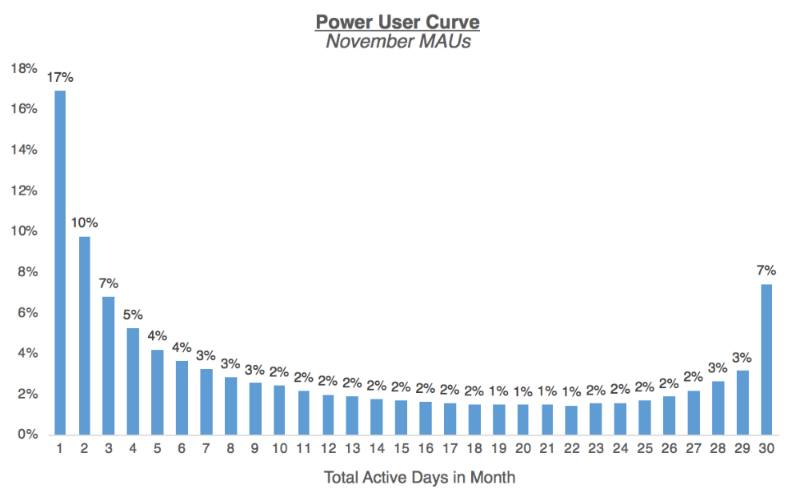
The Power User Curve above is for a social product, and shows the characteristic smile shape that indicates there’s a group of highly engaged users using the app daily or nearly daily. Social products with frequent user engagement like this lend themselves well to monetization via ads—there’s enough users returning frequently that the impressions can support an ad business. Remember that Facebook would have a very right-leaning smile, with 60%+ of its MAUs coming back daily.
Get new updates, usually once a week – featuring long-form essays with what’s going on in tech.
What matters is that, over time, the platform is able to retain and grow its power users: successive Power User Curves should ideally show users shifting over more to the right side of the smile. As the density of the network grow, and with stronger network effects, it’s expected that there’s more reason for users to return on a daily basis.
The Power User Curve can show when strong monetization is needed
Let’s look a different example, which doesn’t smile:
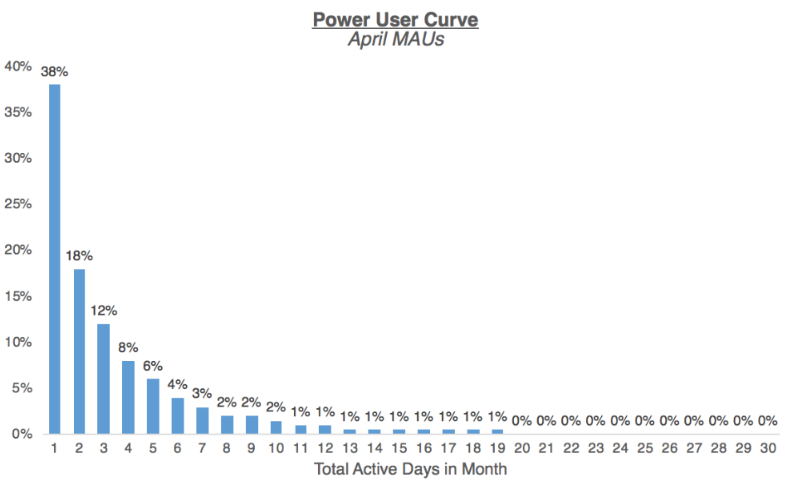
This Power User Curve of a professional networking product looks quite different than that of a social product. It’s left-weighted with a mode of just 1 day of activity per month, and decays rapidly after those few days. There’s no power users. But this light engagement can be okay — not every company needs to have a smile-shaped Power User Curve, just as not every product category necessarily lends itself to an ultra-high DAU/MAU.
When there’s low engagement, what matters is that the company has a way to extract enough value from users when they are engaged. Think about an investing product like Wealthfront or networks like LinkedIn — few users are likely to actively check it on a daily basis, but that’s ok, since they have business models that aren’t tied to daily usage.
CEOs of such companies should therefore,think about: Is there a way to create revenue streams where the business can still monetize effectively despite users’ infrequent engagement? Or, who are the users using this product more frequently, and how can I get more of them? Is there something about the product — e.g. onboarding, the core experience, etc. — where a significant chunk of the user base isn’t experiencing the ‘aha moment’ that makes them “get” the product, and therefore not getting value from it right now (and if so how to get there)?
Some products should be analyzed in a 7 day timeframe – like SaaS/productivity – and others on 30 days
Another flavor of the Power User Curve is a histogram of users’ engagement for a 7-day period, also commonly called L7. The 7 day Power User Curve shows weekly actives, not monthly actives. Plotting this version can make sense if your product naturally follows a weekly cycle, for instance, if it’s a productivity/work-related product that users engage with Monday through Friday. B2B SaaS products will often find it useful to show this version, as they want to drive usage during the work week.
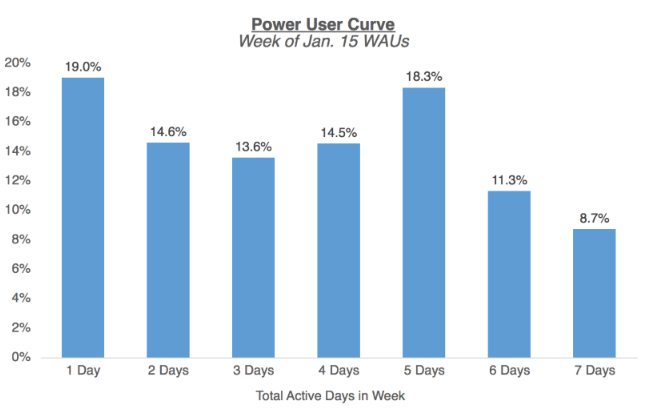
Note that using DAU/MAU wouldn’t be the appropriate metric for this product as it’s not designed to be a daily use product. You can also see there’s actually a smile curve through 5 days, but fewer users are using it 6-7 days, which makes sense for the power users of a workweek product like this.
CEOs of such product companies should therefore want to understand: Who are the users engaging just 1 or 2 days each week? Are there certain teams or functions within an organization that are getting more value, and how can I build out features to capture the teams with less engagement? Or, if the product is really driving a lot of value for specific departments — how can I understand their needs better and make sure we continue building in a direction that supports their daily workflow (and that we can upsell new features)?
The trend of over time can show if the product is getting more engaging over time
Plotting the Power User Curve for different WAU or MAU cohorts can also be very insightful. Over time, you can see if more of your user base are becoming power users, by seeing the shift towards higher-frequency engagement.
Here’s an example:
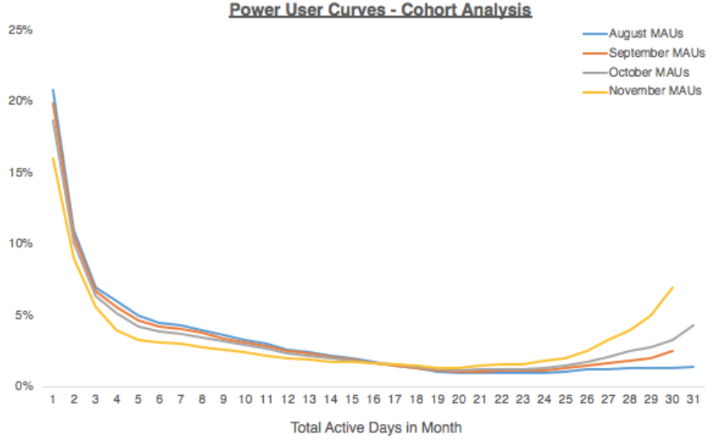
The Power User Curve for MAU cohorts from August through November shows a positive shift in user engagement, where a larger segment of the population is becoming active on a daily basis, and there’s more of a smile curve.
You can see when the line starts to inflect in order to see when a critical product release or marketing effort might have started to bend the curve. This might be a place to double down, to increase engagement. For a network effects product, you might expect to see newer cohorts gradually improve as you achieve network density/liquidity.
On an ongoing basis, you can measure the success of product changes or new releases by looking at different cohorts’ Power User Curves. If a product unblocks a bunch of features for power users, you might see a gradual increase in power users.
The Power User Curve can be based on core activity, not just app opens or logins
The frequency histogram can be keyed on actions beyond the visit — did someone show up or not — you can also go with deeper user actions. For instance, you may want to plot the core activity that maps closely to how your business is monetized… or that better represents whether users are getting value from your product. This is important because it forces you to think about what really matters to measure.
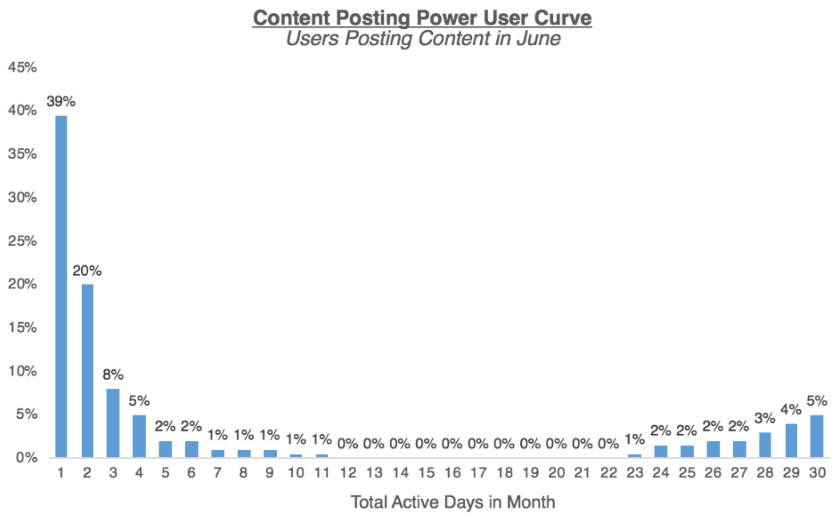
The above chart for a content publishing platform shows the total number of days in the month users posted content. A lot of products have smile-shaped core activity Power User Curves, because while most people tend to contribute lightly, there is a small contingent of users who are power users. Think of the distribution of Youtube creators, or Ebay sellers, or even how often you post on Facebook.
As the CEO or product owner of a platform like this, it’s important to design the platform such that the everyone has a chance to succeed. On Facebook, the news feed algorithm makes sure that if you feel strong affinity to a person or organization, you’ll still see their posts even if the sheer volume of other content (for instance, from more prolific media companies) would otherwise drown it out. On OfferUp, even if I seldom sell items, when I do list something, their algorithm makes sure that it’s surfaced to the relevant potential buyers.
Why does this all matter?
Not everything is a daily use product, and that’s okay.
Power user analysis allows you to get a better understanding of how users are engaging with your product, and make more informed decisions using that data. That might mean choosing an appropriate business model that works for your pattern of engagement, or designing better re-engagement loops for lower-engaged user segments, or doubling down on use cases that your high-engagement user base is already getting value out of.
The beauty of the Power User Curve over DAU/MAU is that it shows heterogeneity among your user base, reflecting the nuances of different user segments (and therefore what drives each of those segments). Creating versions of Power User Curve by various user segments can also be particularly insightful. For instance, for a business with local network effects (like Uber or Thumbtack), showing Power User Curves by market can reveal which geographies are developing density and strong network effects.
Power User Curves show if your product is hitting a nerve among a super engaged core group of users, even if perhaps the overall blended DAU/MAU is low. It also doesn’t have to just reflect app opens or logins — you can hone in on an action that maps closely to users getting specific value out of your specific product and plot the Power User Curve for that action. The key for founders is to know that there isn’t a single silver bullet to measure perfect engagement — rather, the goal is to find the set of metrics that are appropriate for their businesses. Comparing the Power User Curve of a social app vs. a work collaboration app doesn’t make sense, but looking at your own Power User Curve over time, or finding benchmarks for your product category, can tell you what’s working… and what’s not.
[Thanks again to Li Jin for pulling together this essay! Another plug for her Twitter account here. -A]