

How DAU/MAU got popular
DAU/MAU is a popular metric for user engagement – it’s the ratio of your daily active users over your monthly active users, expressed as a percentage. Usually apps over 20% are said to be good, and 50%+ is world class.
How did this metric come into use? DAU/MAU has been a popular metric because of Facebook, which popularized the metric. As a result, as they began to talk about it, other consumer apps came to often be judged by the same KPIs. I first encountered DAU/MAU as a ratio during the Facebook Platform days, when it was used to evaluate apps on their platform.
Get new updates, usually once a week – featuring long-form essays with what’s going on in tech.
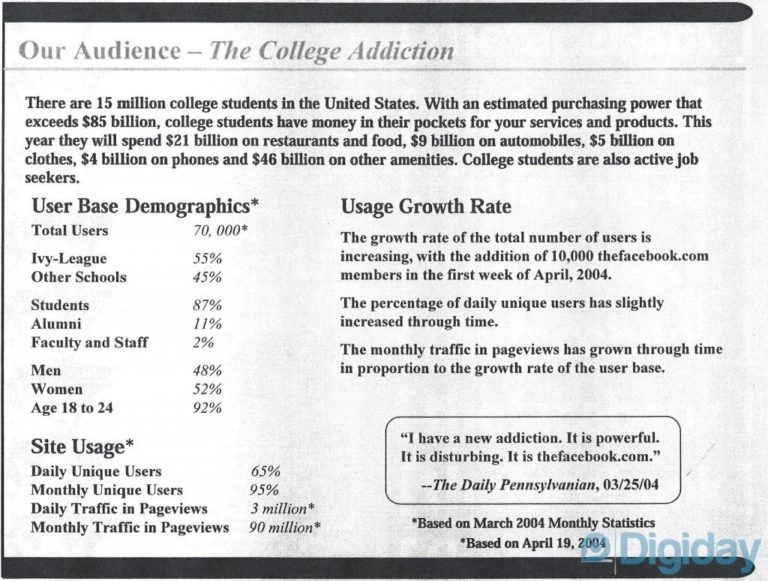
This metric was always impressive for Facebook because it’s always been high. It’s historically been >50%. In fact, I was curious at one point whether or not it’s always been that good. And it has! I found this from a Facebook 2004 media kit showing crazy high numbers even with a small base of 70k users:

Assessing product/market fit with DAU/MAU
It’s an important metric, to be sure, but it’s often misused to say that “XYZ isn’t working” when in fact, there’s a slightly less frequent usage pattern that’s still equally valuable.
For consumer and bottoms up SaaS products, this metric is super useful, but seems to mostly exclude everything besides messaging/social products that are daily use. These are valuable products, but not the only ones.
Products that aren’t daily, but still hugely valuable
Not everything has to be daily use to be valuable. On the other side of the spectrum are products where the usage is episodic but each interaction is high value. DAU/MAU isn’t the right metric there.
- At Uber, our most profitable rides are to airports, via Black Car for a special night out, business travel, etc. These don’t happen every day, and although there are folks using us to commute, that’s not the average use case. So our DAU/MAU wasn’t >50%. The driver side has clusters of “power drivers” who are active >30hrs/week, but as it’s been widely published, our average driver is actually part-time. (Pareto Principle!)
- Linkedin is another interesting example which is low frequency – only recruiters and people looking for jobs use it in daily spurts – but it throws off so much unique data that you can build a bunch of vertical SaaS companies on top of this virally growing database.
- Products in travel, like Airbnb and Booking, are only used a few times per year by consumers. The average consumer only travels ~2x/year. Yet there are multi deca-billion dollar companies built in this space.
- In fact, for SaaS, it seems to be the exception not the rule. While email and business chat can be nearly daily use, a lot of super important tools like Workday, Google Analytics, Dropbox, Salesforce, etc. might only be used 1-2x/week at most.
- Much of e-commerce looks like this too, of course. You buy mattresses, new sunglasses, watches, etc fairly infrequently. Yet there are $1B+ wins in the category.
You may notice a pattern here. If you’re low-frequency/episodic, then you have to generate enough dollars or data that it’s valuable. If you’re high-frequency, you have a higher chance of growing virally and building an audience business that monetizes using ads.
Nature versus nurture
To extend this idea further, you can argue that messaging/social products with high DAU/MAU is actually the extreme case, and in fact most product categories don’t index highly. A few years back I shared this interesting diagram from Flurry which compared different app categories and their retention versus frequency of use:
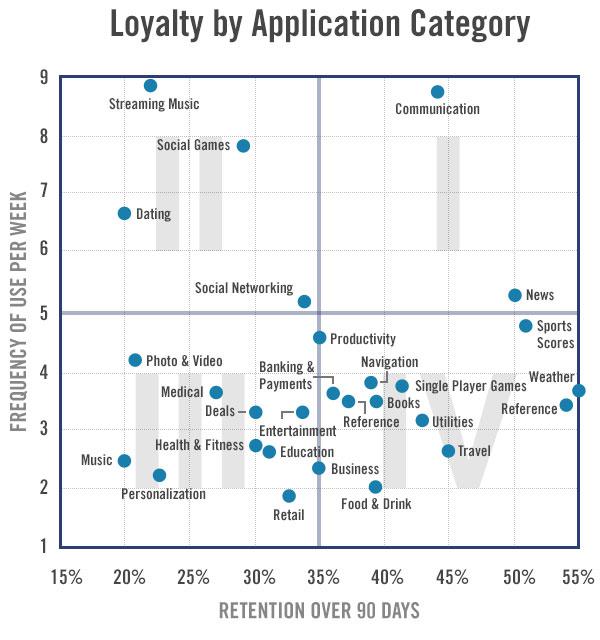

In this chart, a couple categories jump out:
- Social games have high frequency (“I’m getting addicted!”) but once you burn through the content, you tend to churn
- Weather is interesting too – you don’t often check, maybe only on cloudy days, but you will have a need to check throughout your entire life- so it maxes out on highest retention rate over 90 days
- Communication, for all the reasons discussed before, is both high frequency and high retention. That’s awesome!
What I’d love to see on this chart would be another overlay, monetization. There, I bet Travel, Dating, and Gaming would tend to stand out for different reasons. Travel because each transaction is big, and Dating/Gaming because it’s frequency combined with a focus on monetization because you won’t have the user for long.
So you want to increase DAU/MAU? It’s hard
So let’s say that you want your DAU/MAU to increase – so what do you do? Funny enough, a lot of people seem to implement emails and push notifications thinking it’ll help. My experience is that it tends to increase casual numbers (the MAU) but not the daily users. In other words, it’ll actually lower your DAU/MAU to focus on notifications because you’ll grow your MAUs more highly than your DAUs.
I’ve also not seen a 10% DAU/MAU product, through sheer effort, become 40% DAU/MAU. There seems to be a natural cadence to the usage of these product categories that doesn’t change much over time.
Increase, measure your hardcore users, network effects, monetization
If your DAU/MAU isn’t super high, this is what I like to see instead: Show me your hardcore userbase. What % of your users are active every day last week? What are they doing? How are you going to produce more of them? Showing this group exists goes a long way.
Similarly, show how the freq of use increases in correlation to something. Perhaps size of their network – showing network effects – or how much content they’ve produced or saved. Then make the argument that by increasing that variable, DAU/MAU will rise in cohorts over time.
Finally, maybe DAU/MAU is just not for you. Sometimes you don’t have to be a foreground app to be successful. Maybe you just need to build something awesome that does something valuable for people, makes enough money, and they use it twice a year! Also great.
DAU/MAU is useful, but has its limits
In conclusion, if your product is a high-frequency, high-retention product that’s ultimately going to be ads supported, DAU/MAU should be your guiding light. But if you can monetize well, develop network effects, or quite frankly, your natural cadence isn’t going to be high – then just measure something else! It’s impossible to battle nature… just find the right metric for you that’s telling you that your product is providing value to your users.

