About the author: Kenton wrote this fantastic piece about analyzing in-app revenue, drawing from his work experience at both Zynga, where he runs their mobile poker product, and before that, Google. You can follow him at @kivestu and his blog here. -Andrew

When I worked at Google, Eric Schmidt used to say “Revenue solves all known problems.” He was right.
And if you’re monetizing a mobile app today, there is a good chance that in-app purchases (IAP) are a critical component of your monetization (if not the sole pillar).* Yet we don’t have great tools for understanding the mechanics of revenue models driven by IAP. Financial analysts who wrestle with similar problems can shed some light.
Financial analysts often use a technique called DuPont Analysis – named after the famous chemical company that created it – to understand what components of a business are driving financial returns.
The DuPont Analysis equation looks like this:
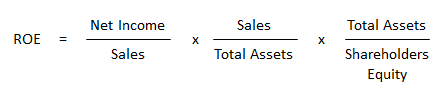
This equation states that if you take a company’s profit margin, asset turnover and financial leverage, multiply them together, you’ll get Return on Equity (ROE) – a measure of how much profit a company generates per the amount invested into the company. It’s an insightful way to quickly understand what is the driving force behind returns (and also known to be one of Buffet’s favorite metrics).
The key insight from DuPont analysis is the principle of decomposing a common metric into the components that drive it.
To successfully monetize via IAP you need a deeper understanding of revenue drivers – top line revenue or even revenue / daily user (aka ARPU) is not enough. A more sophisticated understanding starts with the Transactions Payers Revenue (TPR**) equation:
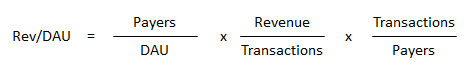
Rev/DAU (aka ARPU) is a quick measure of how much revenue you’ll make for each user you have on a given day – it’s an overall indicator of your ability to monetize your users.
Payers/DAU measures how many of your users on any given day actually pay – meaning on that particular day X people actually transacted within your app.
Rev/txn measures how much each transaction was worth – this is particularly important for developers that have a large range of price points available in their app (as many games do, for example). Note: If you only sell a single item this metric will be a constant equal to the price of that item.
Txns/payer measures the number of transaction you got for each payer you had in the app in any given day (eg how many transactions did the avg. payer complete.)
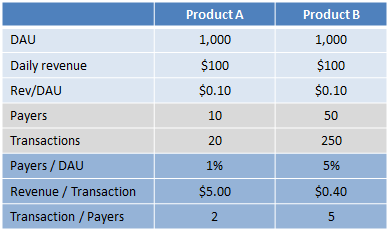
Let’s run through a mechanical example. Let’s say two different mobile apps have a $0.10 rev/DAU. On the surface, it might seem like these apps are similar:
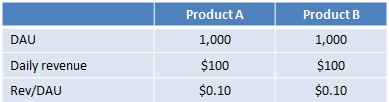
But if you dig a little deeper and collect the other key metrics we’ll need for TPR analysis, differences will manifest themselves:
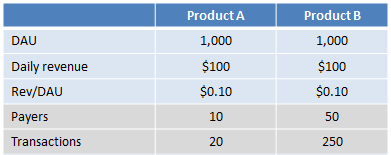
And if you run the calculations, your picture now looks like this:
So what?
The chart above is critical to understand if you’re focusing on improving monetization because it tells you where your leverage points are. For example, if you’re the CEO of product B and you tell your VC that the critical way you’re going to grow revenue is by converting more payers, your VC ought to call BS. Why? Because 5% of daily users paying is already pretty damn good. You might be able to get 5.1% or even 5.5%, but that won’t move the bottom line much. A 10% improvement on an already stellar number, would equate to an extra $10 / day (10% improvement on payers means 5 incremental payers, each doing 5 txns / day, giving you $10+ bucks a day).
However, if you instead focused on increasing the revenue per transaction, you might find there is significant upside. After all, people shell out in excess of $0.99 for a single Coke in most places around the world, so it seems like your revenue per transaction has head room to grow. Maybe by highlighting volume discounts (or some other product tweak) you could get revenue per transaction up to $0.60. It’s not quite a Coke yet, but hey, its an improvement. That would be pretty great though – and it’d net you a $50 bottom line improvement, not bad!
What next?
The TPR equation, while helpful, is just the first step. Any thorough understanding of IAP revenue will require peeling back another layer of the data. For example, is payers / DAU being driven by active payers or new payer conversion? Or what about lapsed payers returning to the app? What about “red herrings”? In some cases, an increasing rev/DAU metric might actually point to long term problems acquiring and monetizing new payer (this can happen when new DAU starts declining, new payer conversion dips and rev/DAU looks healthy because committed, elder users of the app are pushing it up). More on these more nuanced layers in a followup post.
Footnotes
*The most recent Distimo data suggests that revenue from IAP no accounts for 70%+ of app store total revenues, up from ~50% in Jan. 2012.
**TPR stands for Transactions Payers Revenue. I didn’t want to be narcissistic and name if after myself and TPR sounds official, akin to those TPS reports (albeit hopefully more valuable).

