[Andrew: There’s very little data out there on mobile, and so in the last few weeks, I’ve had guest posts on the % of users who opt-in to push notifications, as well as clickthrough rates of push. Today, I have some new metrics around retention, including for the first time, a systematic study of D1/D7/D30 retention for mobile apps. This is released by Mack Flavelle of Tapstream, who you can follow on Twitter]
Mack Flavelle, Tapstream:
As most app developers know, retaining new users is hard and some would say it gets harder every year. At Tapstream we wanted to test that notion so we looked at anonymized aggregates of attribution data collected by our platform as our customers acquire and engage their mobile users. The steep decline of engagement rates year over year was a surprise even to us.
We compared data from May 2013 to data from May 2014. To give you some context, in May 2013 an average app developer would retain about a quarter of their users a day after acquisition.
This is what keeps marketers up at nights: it means that three quarters of their acquired users didn’t stick around even for one day.
But when compared to May 2014, 25.5% retention on day one suddenly started looking very good:
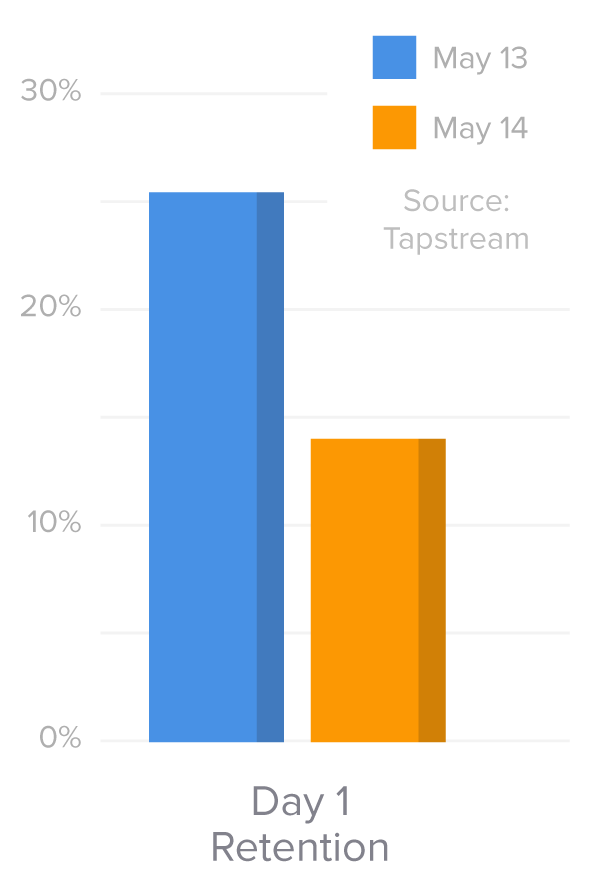
On average only 14% of users stuck around a day after downloading an app. That is less than one in seven users. Those are abysmal rates by any measure.
This is exactly why we at Tapstream created Onboarding Links: to engage new users the moment they run the app for the first time. Reducing the app abandonment rates is becoming a crucial part of user acquisition.
Beyond day one
Another dimension of this data is looking further down the funnel to see how user retention fared at day 7 and day 30 after acquisition.
Again, the results are not encouraging:
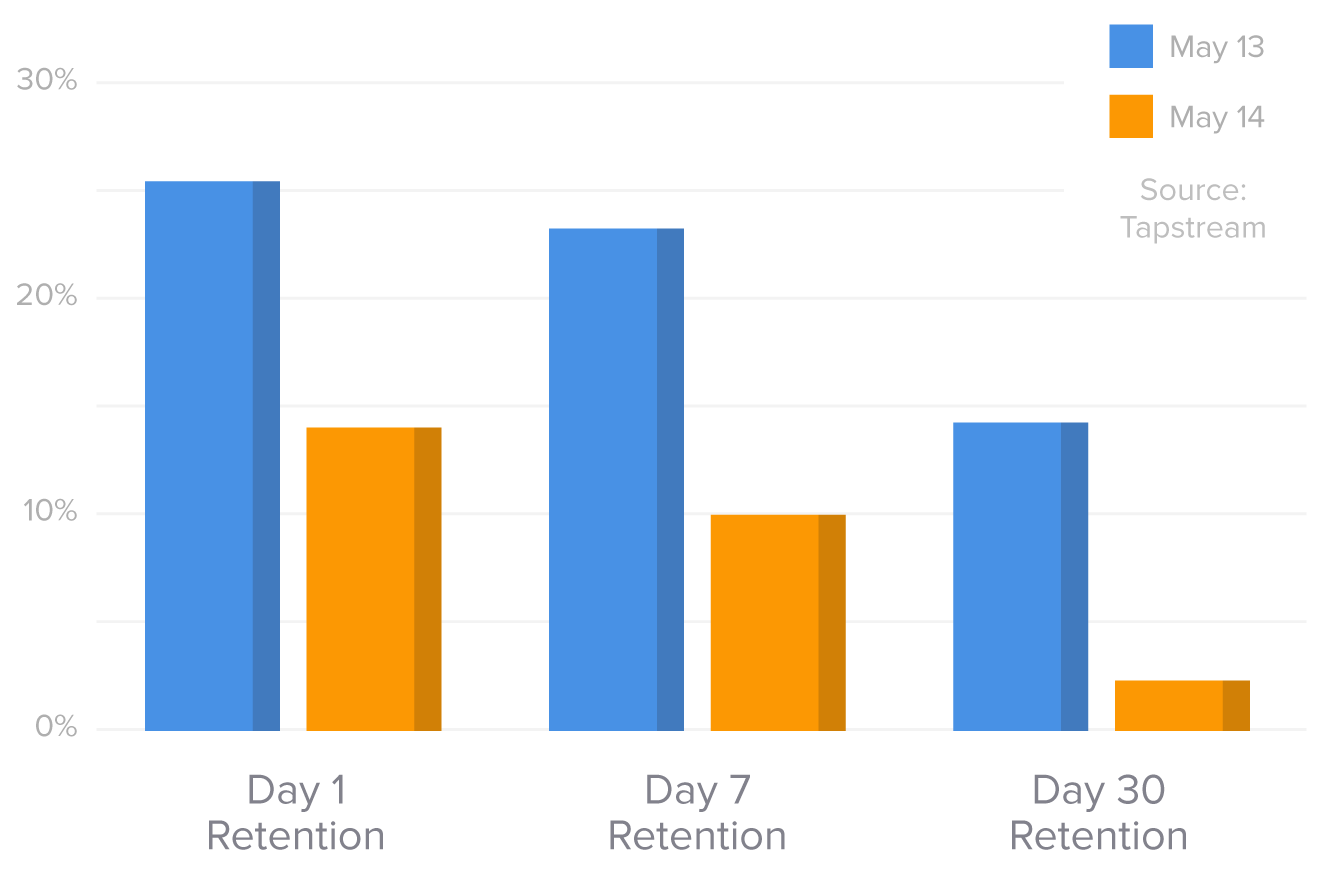
Day 7 retention went from a respectable 23% to a measly 10% in May 2014, while Day 30 retention plummeted from 14% to 2.3% – a full 84% decrease.
To put this into perspective, the average next-day retention rate in May 2014 is almost the same (14.06%) as Day 30 retention rate a year ago (14.30%).
The story behind the numbers
What’s causing this dynamic to play out in the mobile app ecosystem is up for debate, but here are the most obvious culprits for why user retention in mobile has dropped 50% in the last year:
Incredibly low barrier to entry so no sunk cost loyalty
It takes about 10 seconds, a smattering of taps and usually zero dollars before a consumer is the proud new owner of your app. But easy come, easy go – there’s usually so little investment in your app there’s no pain of switching. As table stakes for app design get raised (remember when every app used default nave elements and controller views?) the next shiny thing to come along and grab consumer attention really is very shiny.
Incredibly low barrier to entry so no filter on user quality
When you have an expensive product and somebody buys it you can generally assume they did some research beforehand and had an idea of what they were getting into. They essentially self-filter to be loyal users by the time they engage with the product. With apps any such assumptions are out the window – there is nearly zero intent signalling by the consumer, even after they have “purchased” your app.
Disconnect between time of download and first open
There’s often a lack of context when a new user opens an app. This isn’t Christmas morning, unwrapping the box hoping for an NES. Between the moment somebody absent-mindedly downloads your app and opens it for the first time they’ve probably checked Facebook six times, Twitter three, bid on two obscure statues on Ebay and attended a funeral. The likelihood of them remembering the emotional switch that got them to download is reasonably slim.
Forklifting apps and other bad initial experiences
One of the tricks du jour, championed by the Japanese card games and the genre they inspired, is forklifting content into the app on first open. Sure the app itself is tiny, you don’t even need WiFi to get it, but then there’s a six-minute load time the first time you open it. This and other terrible first-run experiences can lead to serious drop off.
None of those explain the drastic decrease in retention over the last year. That may be a byproduct of the explosion in available apps. In fact most people would assume so, considering the huge number of apps available today.
The problem with that theory is that in May of 2013 nobody said
“I really wish there were more than half a million apps available, because I would definitely download and use more”
Arguably the variety of supply already far outstripped the demand.
So the relevant info becomes how many apps are being downloaded per device in May 2013 versus a year later. Are people downloading more apps and that’s why they’re not sticking around, or are they downloading better apps which is why they’re not sticking around?
Lucky for us one of the smartest minds in mobile started looking at that last year.
“Finally, these numbers are accelerating. Apple did 5bn downloads in the three months from December 2012 to March 2013, and then another 5bn from March to 15 May. The lack of precision means we can’t say this was double the rate, but the trend is clear, and it looks the same at Android…”
– Benedict Evans, from his blog.
Assuming Ben is right (and he often is) we can infer a gentle increase in the number of apps downloaded per phone, coupled with a higher quality of apps across the board has meant that the competition in the app store has become more fierce not only in terms of number of animals in the jungle but also the ferocity of those animals. Both of these factors end up driving down user retention in mobile apps versus a year ago.
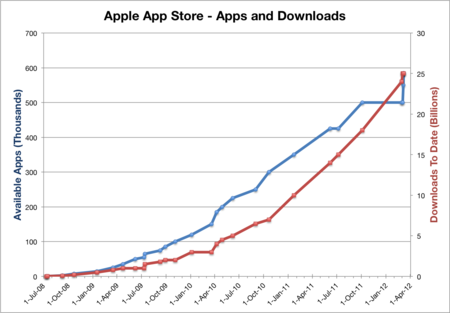
source: http://en.wikipedia.org/wiki/App_Store_(iOS)
Though this chart ends in 2012 and is iOS-specific we know that the trend continues but only steeper across both ecosystems as seen here and here.
About data used to generate this report:
Data was collected by Tapstream for months of May 2013 and May 2014 from over 100M devices. It is anonymized and it includes both iOS and Android apps, spanning many verticals from gaming to travel. The data excludes apps with DAUs of over 1M.