Surprisingly, it can be hard to figure out if you’re at Product/Market Fit or not, and one of the big reasons is that comparable numbers are difficult or impossible to come by. You have to look at comps for products in a similar or equal product category, and sometimes they just aren’t available.
Nature versus nurture
One way to think about this is that products have a nature/nurture element to their metrics. Some product categories, like chat or email, are naturally high-frequency. You use them a lot. Other products, like tax software, might give you value but you only use it once per year. A lot of ecommerce products are in-between, where you might buy gadgets every couple months but not every day. Just because people only use your product once a year doesn’t mean you don’t have product/market fit, as long as you’re building a tax product and not chat.
The two extremes are interesting:
- Medical apps: They may have high retention since if you have a chronic ailment, you may constantly be using an app relevant to your condition, but maybe not every day
- Books/Games: You read them nonstop for a few days or a week or two, and then once you’ve consumed the content, you never go back
The point I’ll make on this is that due to the nature of certain product categories, there’s a natural range of DAU/MAUs, +1 day and +1 week retention metrics. That’s the “nature” part of the product category. No matter how good your tax software is, you won’t get people to use it every day.
Based on your product execution though, you can maximize the the metrics within the natural range. A really good news product like Flipboard is able to drive 50%+ DAU/MAUs, which are fantastic.
Some product categories cannot get high DAU/MAUs
One key conclusion of this is that it doesn’t make sense to try to compare against Twitter or Facebook’s 50% DAU/MAU unless you are in the same category as them. A lot of social games target 30% DAU/MAU, but we can also see from the Flurry chart that social games are also amongst the highest DAU/MAU categories.
That said, if you are in the same category, then these rival products really tell you how good your metrics could really be, if you executed them in the right way.
Either way, don’t fight your nature :)
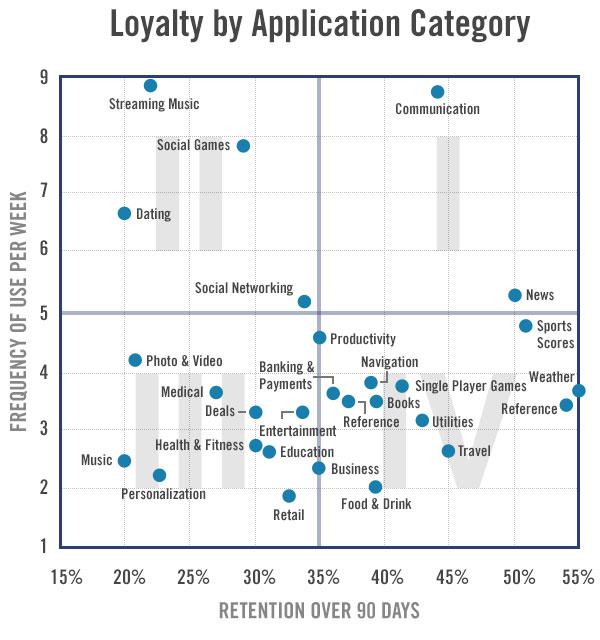
Update: New chart from Flurry
A while after I wrote this, Flurry released a new version of their chart, which you can see below. Full article here. It’s interesting to see which categories have shifted a bit, I imagine because the number of new apps in each category has changed a lot.