Push notifications are a cornerstone of every mobile app’s engagement and retention strategy, yet we know so little about them. Previously I’ve written about why 60% of users opt-out of push notifications and why some pushes are getting 40% CTRs.
Today, we’ll look at some push notification data from Leanplum, a mobile marketing automation tool, which breaks down 671 million pushes to uncover some interesting trends, particularly on time of day targeting for push notifications.
Average weekday push notification activity in North America
Let’s first look at when marketers are sending push notifications, by hour, and how users are interacting with these pushes. The graph below shows the metrics for push notification sends and opens for the average weekday in North America, on a sample of millions of notifications. The data is normalized by local hour, and represents the raw sends and opens for that given hour. The blue line shows the raw number of sends and uses the left axis. The red line shows the raw number of opens and uses the right axis.
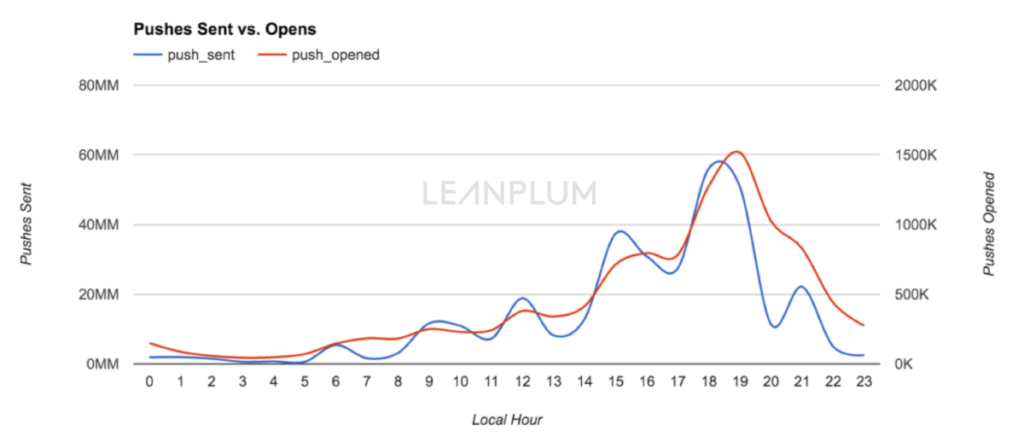

You can see an interesting trend here- you can see pushes sent and opened trending upward throughout the day, with a small peak around noon, a slightly larger one around 3pm, and the largest in the evening. The post-evening trend is interesting – after 6pm, on a relative basis, Pushes Opened starts to trend higher, relative to previous hours, and Pushes Sent is lower. This indicates that while mobile apps are delivering a ton of pushes leading up to evening, it might be more effective to time them post-evening, when engagement seems high.
Either way, this curve is super interesting, and we should look at a typical day to understand the behavior patterns on how people spend their days.
Studies on the average day reinforce this trend
The American Time Use Survey visualization below shows why the aforementioned push notification graph makes sense. The video simulates the minute-by-minute average day of activities for 1,000 people, and what they do- some phone calls to sports to shopping to work.
View the visualization video here or click the image below:

In the morning hours from 7-9am, people are waking up and kicking off their morning rituals – eating, personal care, commuting to the office, and beginning to work. These consistent morning tasks that get you to the office and productive could justify why push engagement is low before 12pm. Around 3pm there is an interesting activity shift seen in the video that also correlates with a higher push send and open rate. This could be people taking a break to grab a coffee or get outside. Great time to take a look at your phone. By 6pm, most people have left work and transitioned to leisure activities.
It makes sense then why opens of push notifications are so high from 6-9pm. Work is done and people are likely to be on their phones, browsing apps and catching up on social media. The shift to leisure activities lasts for a few hours and by 10pm, most people have moved to personal care and sleep. The peak of push notification engagement follows a similar shape of post work leisure time.
Media consumption by medium
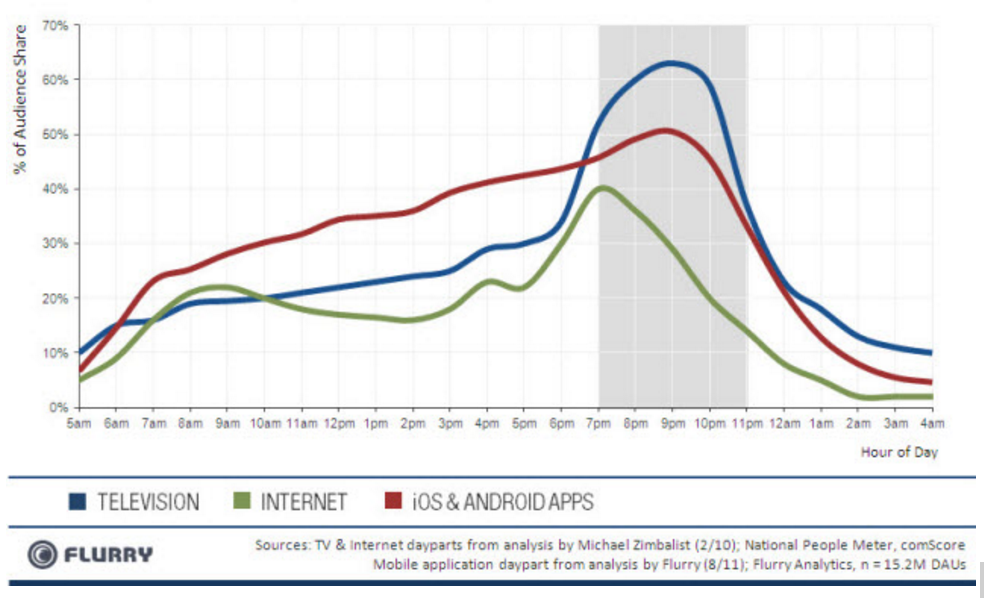
Ok, so we see that leisure activity correlates with higher opens of push notifications. What exactly are people doing during these leisure hours? The Flurry graph of daily media consumption by channel shows some interesting trends:

Couple obvious notes:
- Internet usage has two main peaks: one at 8am and a larger one at 7pm.
- iOS and Android app usage kicks up in the morning around 7am, gradually builds throughout the day before falling off its peak at 9pm.
- TV is clearly an after work deal, with a huge peak between 7 and 11pm.
You can match this up to this similar chart analyzing media consumption in the UK, via Ofcom:
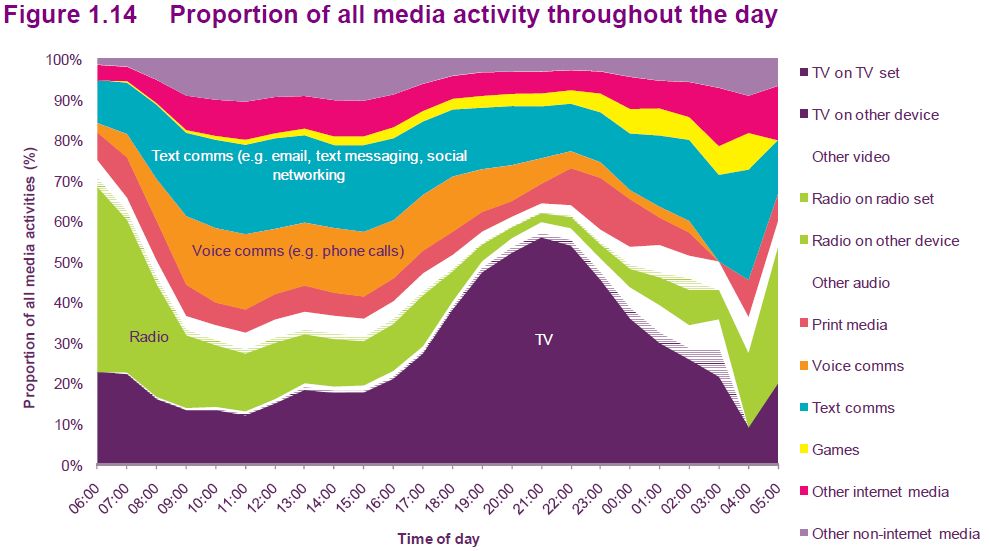
With both charts, you can see that, TV appears to be a significant portion of the leisure hours, especially after work. Voice communication tends to be constrained to the day, while online comms (SMS/email) happens throughout the day.
Push notification engagement versus media consumption
To tie this daily pattern to the Leanplum push notification engagement data, we can speculate why people are engaging with pushes in the evening. I bet we’re seeing the effect of mobile as the second screen, where people are engaging with push notifications while casually watching TV. They likely have their phones in their pocket or nearby, and can easily catch up on apps.
Thanks to David Grotting and Leanplum for their help on this essay.

