

Dear readers,
I’m happy to announce I’ve completed my first year in my new role at a16z, and it’s been a blast! I will write more about it coming up, but in the meantime, it’s very timely that my colleague Scott Kupor has written a new book, Secrets of Sand Hill Road, with the fun subtitle “Venture capital and how to get it.” I’ve had the pleasure of reading ahead of its release, and as expected, it’s excellent, and provides a detailed guide and fantastic in depth info on everything you’d want to know about venture capital. As an author, Scott could not have more street cred — he joined and built a16z from the very early years, and is our go-to on all the nitty gritty of the industry for the whole team.
You can (and should!) pre-order the book here »
There’s a bunch of great topics, including:
- Why the skill you need most when raising venture capital is the ability to tell a compelling story.
- What to do when VCs get too entangled in the day-to-day operations of the business.
- Why you need to build relationships with potential acquirers long before you decide to sell.
- Why most VCs typically invest in only one startup in a given business category.
The math of startups and venture capital
Of all the topics of the book, one of my favorites has to be the math of startups and venture capital, because it gives us a perspective on the life and death of startups as a whole. Because venture capital is an index of the broader startup ecosystem, it can tell us a lot — everything from how often the Ubers, Dropboxes, Facebooks, and Googles emerge as startups, to how quickly doomed startups typically fail.
All of these tell you why many venture capitalists ultimately end up being interested in companies that want (and can!) get big — and it’s not the right way to finance the vast majority of new companies, many of whom are more focused on smaller markets or slower growth business models. I want to share a couple slides that Benedict Evans from a16z presented a few years back to make this point:
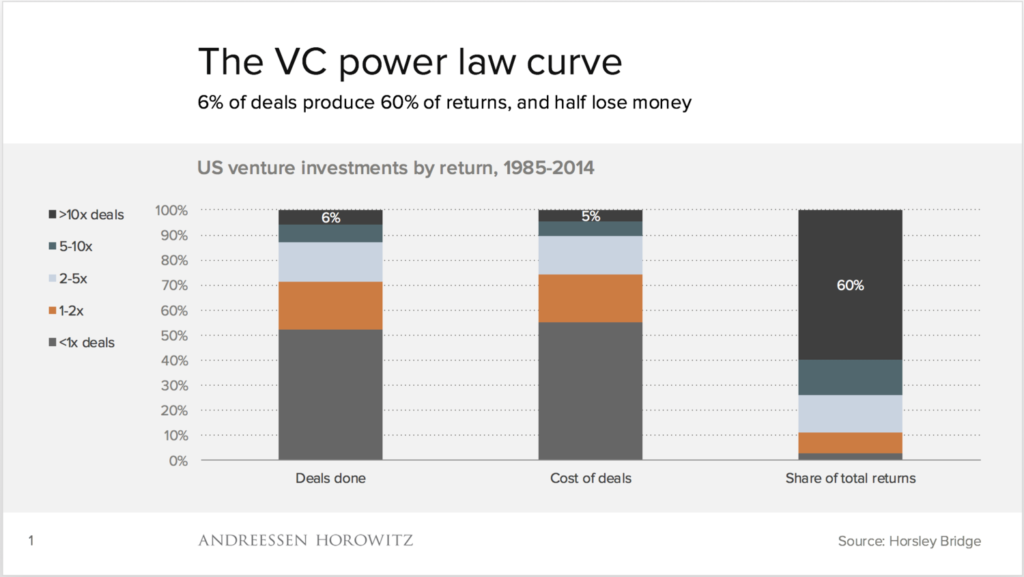

The above tells an amazing story: Over the past few decades, a small number of startups — 6% — end up driving 60% of the returns.
And I suspect if we were to dig into the 6%, we see that just a small number, probably a dozen or so per year, that drive a substantial amount. In other words, the startups that end up big end up really big. These startups aren’t just unicorns, they are another order of magnitude more successful than that.
It also tells you why, as an entrepreneur, that investors are so focused on network effects, high margins, technology differentiation, a 10X product experience, etc. — these are the foundational drivers that help create this super huge outcomes.
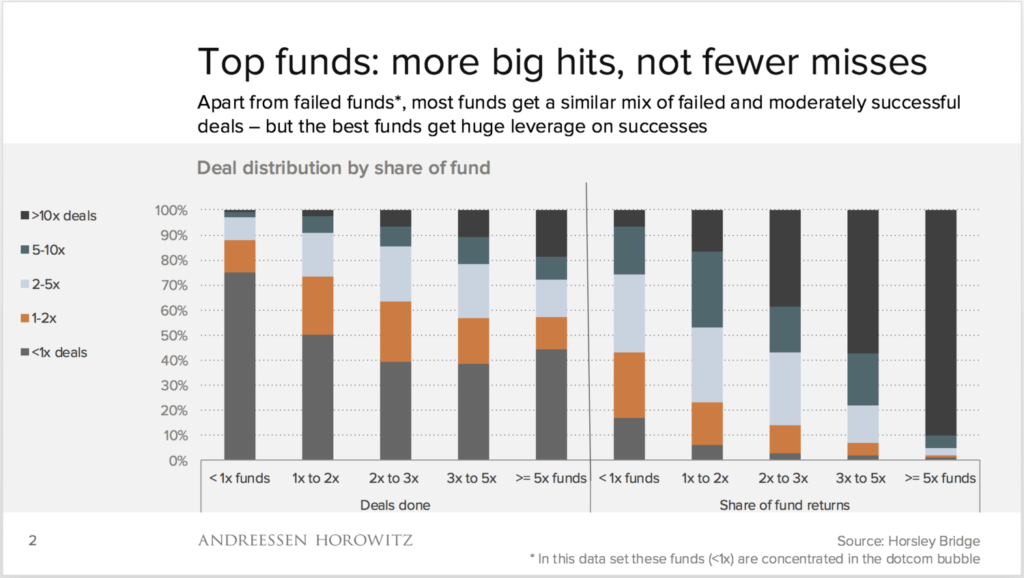
Above: Here’s another surprise from the data, which is that the best investors don’t seem to be better at avoiding startups that fail. It’s not about the downside. Instead, the data says that a “good” 2-3x fund and a fantastic >5x fund lose money about the same % of the time.
However, for a fantastic fund, its winners are much, much bigger than everyone else’s. For these top funds, the biggest startups end up generating 90% of the returns. It’s all about upside! For startups that ask why investors seem so obsessed with market size and say that few ideas are big enough, here’s the data that explains why.
The J-Curve
Finally, there is the concept of the J-curve in venture capital investing in which you look at a basket of startups over a long period — say, 10 years — and see how the returns look. And it often resembles a J, where the early years look pretty bad! And then eventually the big winners get bigger and bigger, picking up momentum to ultimately drive returns for the fund.
It looks like this:


This graph demonstrates the phrase that “lemons ripen early” — as Secrets of Sand Hill Road discusses. A portfolio of startups will often have early losses as the teams without product/market fit run out of money early. The successful ones that will become the winners take time to emerge. These days, it can take 3-5+ years from the company’s inception to see its true growth trajectory. As a result, there’s a J-curve that shows early losses followed by the successful startups making up the different in the later years.
If you are as fascinated as I am about all of this, I know you’ll enjoy Scott’s book. I want to leave you with an excerpt below. In the section, he discusses the J-curve in detail and why it behaves why it does. Hope you enjoy it!
Thanks for reading, and more from me soon.
Andrew
Secrets of Sand Hill Road: Venture Capital and How to Get It
by Scott Kupor
“Carried Interest”
The heart of compensation for GPs (at least for those who are successful investors) is carried interest. It’s rumored that the term “carried interest” derives from medieval traders who carried cargo on their ships that belonged to others. As financial compensation for the journey, the traders were entitled to 20 percent of the profits on the cargo. That sounds very civilized, if not rich. I’ve also heard—although my Google search is failing me now—that the carry portion of carried interest referred to the fact that the traders were allowed to keep as profit whatever portion of the cargo they could literally “carry” off the ship of their own volition. I prefer that story.
Regardless of its historical origins, carried interest in the VC context refers to the portion of the profits that the GP generates on her investments and that she is entitled to keep. As with the management fee, the actual amount of carried interest varies among venture funds but often ranges between 20 and 30 percent of the profits.
As it turns out, how we define “profits” and how and when the GP decides to distribute those profits to herself and her LPs is a matter for negotiation in the LPA.
Let’s use a simple example to illustrate.
Go back to that $100 million venture fund we talked about before, and assume that we are in year three of the fund’s existence. The GP invested $10 million in a portfolio company earlier in the fund’s life, and now the company is sold for $60 million. So, on paper at least, the GP has generated a tidy profit of $50 million for that investment. She’s also invested the rest of the $90 million in other companies, but none of those has yet been sold or gone public. Ah, she can taste the carry check already!
But how does the money get divvied up between the LPs and the GP? Let’s assume that the GP has a 20 percent carried interest; in simple terms that means that when the fund earns a profit, 20 percent of that goes to the GP.
So, in our example, the GP is sitting on a $60 million check, of which $50 million represents profit, and wants to give 80 percent of the profit (or $40 million) to the fund’s LPs and keep 20 percent (or $10 million) for herself. The other $10 million in this example will go back to the LPs as a return of their original capital. We’ll come back to this later in this chapter and add some additional complexity to this.
But wait a second. Is there really a profit on which the GP is entitled to take her 20 percent? The answer is maybe. We need to take a little detour to introduce two other important concepts before we can conclusively answer the question.
As with fine wine, VC funds should get better with age. In fact, that’s why people in the industry refer to funds by their “vintage year” (or birth year), just as winemakers date mark their wines based on the year of the grape harvest.
As we discussed earlier, in the early years of a fund, VCs are calling capital from LPs and investing that capital in companies. This is a decidedly negative cash flow motion—money is going out with (likely) no near-term prospect of money coming in. That’s an expected effect, but eventually a VC must harvest some of those investments in the form of those companies going public or being sold.
The effect of calling capital from LPs in the early years coupled with the long gestation cycles for companies to grow and ultimately exit—in many cases it takes ten or more years for companies to be sold or go public—creates what is known as the “J curve.”
As you see in the above picture, the LP has negative cash flow (from the capital it’s giving to the venture firm for investment) in the early years of a fund and (hopefully) positive cash flow in the later years of the fund, a combination both of the capital having already been called and invested and the portfolio companies being sold or going public.
Venture capital is truly a long-term game. But, as explained in our discussion of the Yale endowment in chapter 4, cash does eventually need to come out the other end. Successful GPs will manage their portfolios to drive to this outcome, which can affect how they interact with entrepreneurs on this topic.
One phrase you often hear in the hallowed halls of VC firms is “lemons ripen early.” That is, the non-performing companies tend to manifest themselves close in time to the initial investment. Interestingly, this exacerbates the J-curve problem in that not only are VCs investing cash in the early years of a fund, but the non-performing assets are certainly not helping the GP return money to the LPs.
Reprinted with permission of Portfolio Books

