New data shows losing 80% of mobile users is normal, and why the best apps do better
Exclusive data on retention curves for mobile apps
In a recent essay covering the Next Feature Fallacy, I explained why shipping “just one more feature” doesn’t fix your product. The root cause is that the average app has pretty bad retention metrics. Today, I’m excited to share some real numbers on mobile retention. I’ve worked with mobile intelligence startup Quettra and it’s founder/CEO Ankit Jain (formerly head of search+discovery for Google Play) to put together some exclusive data/graphs on retention rates** based on anonymized datapoints from over 125M mobile phones.
Average retention for Google Play apps
The first graph shows a retention curve: The number of days that have passed since the initial install, and what % of those users are active on that particular day. As my readers know, this is often used in a sentence like “the D7 retention is 40%” meaning that seven days after the initial install, 40% of those users was active on that specific day.
The graph is pretty amazing to see:
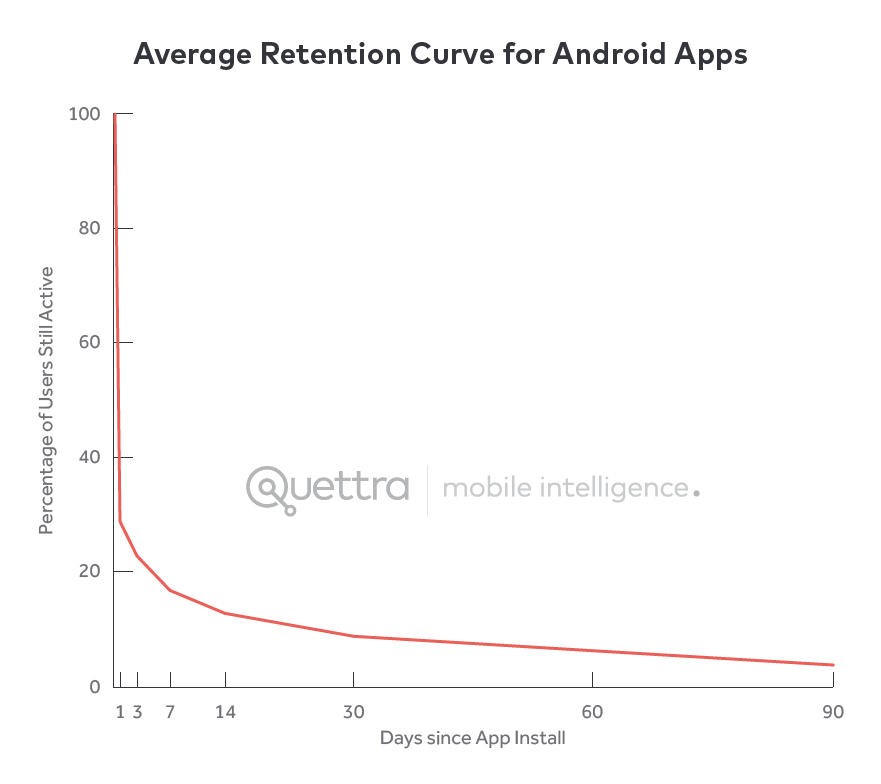
Based on Quettra’s data, we can see that the average app loses 77% of its DAUs within the first 3 days after the install. Within 30 days, it’s lost 90% of DAUs. Within 90 days, it’s over 95%. Stunning. The other way to say this is that the average app mostly loses its entire userbase within a few months, which is why of the >1.5 million apps in the Google Play store, only a few thousand sustain meaningful traffic. (*Tabular data in the footnotes if you’re interested)
Ankit Jain, who collaborated with me on this essay, commented on this trend:
Users try out a lot of apps but decide which ones they want to ‘stop using’ within the first 3-7 days. For ‘decent’ apps, the majority of users retained for 7 days stick around much longer. The key to success is to get the users hooked during that critical first 3-7 day period.
This maps to my own experience, where I see that most of the leverage in improving these retention curves happen in how the product is described, the onboarding flow, and what triggers you set up to drive ongoing retention. This work is generally focused on the first days of usage, whereas the long-term numbers are hard to budge, no matter how many reminder emails you send.
Note that when we say that these DAUs are being “lost” it doesn’t mean that users are suddenly going completely inactive – they might just be using the app once per week, or a few times per month. Different apps have different usage patterns, as I’ve written about in What factors influence DAU/MAU? with data from Flurry. Just because you lose a Daily Active User doesn’t mean that you’re losing a Monthly Active User, yet because the two correlate, you can’t sustain the latter without the former.
Get new updates, usually once a week – featuring long-form essays with what’s going on in tech.
How do the best apps perform? Much better.
The second graph we’ll discuss is a comparison of retention curves based on Google Play ranking. The data shows that there is a very clear and direct correlation:
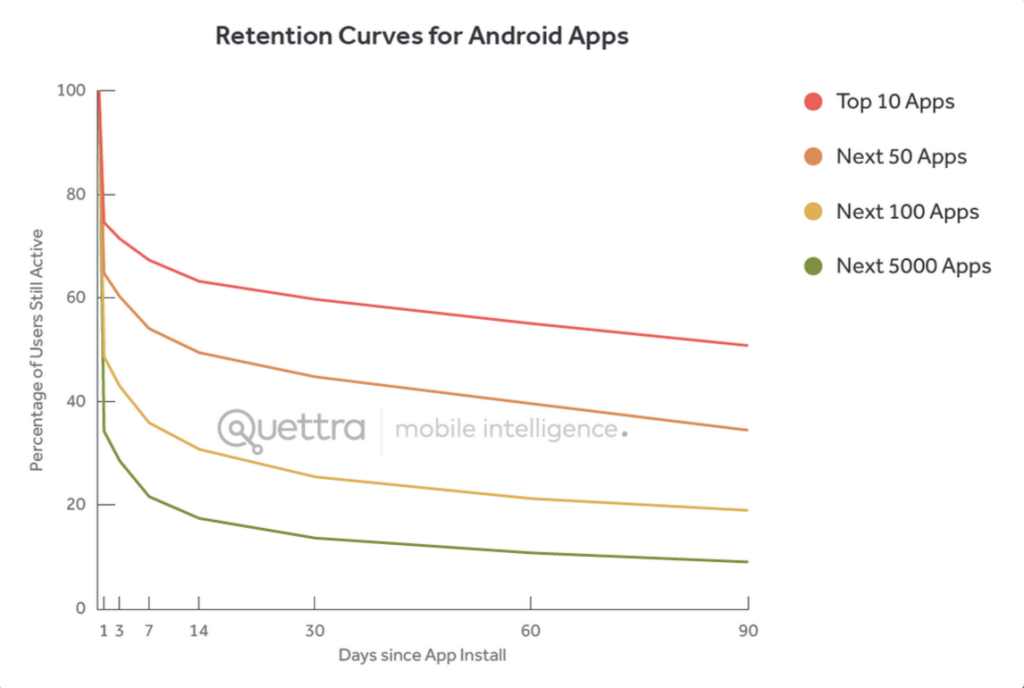
The top apps have higher D1 retention rates, and end with much stronger absolute D30 numbers. However, interestingly enough, the falloff from D1 to D30 is about the same as all the other apps. Another way to say it is that users find the top apps immediately useful, use it repeatedly in the first week, and the drop off happens at about the same speed as the average apps. Fascinating.
Bending the curve happens via activation, not notification spam
To me, this is further validation that the best way to bend the retention curve is to target the first few days of usage, and in particular the first visit. That way, users set up themselves up for success. Although the data shown today relates to mobile apps, I’ve seen data for desktop clients and websites, and they all look the same. So whether you’re building a mobile app or something else, the same idea applies:
- For a blogging product, you might want users to pick a theme, a name, and write their first post, to get them invested.
- For a social service, you might want users to import their addressbook and connect to a few friends, to give them a strong feed experience and opt them into friend notifications
- For a SaaS analytics product, you might want users to put their JS tag on their site, so that you can start collecting data for them and sending digest emails
- For an enterprise collaboration product, you might want users to start up a new project and add a couple coworkers to get them started
Each of the scenarios above can have both a qualitative activation goal, as well as quantitive results to make sure it’s really happening. Whatever you do, sending a shitload of spammy email notifications with the subject line “We Miss You” is unlikely to bend the curve significantly.
I hate those, and you should too.
(Thanks again to Ankit Jain of Quettra for sharing this data and assisting me in developing this piece. More from them here, which examines app-by-app retention rates for messaging apps)
*Tabular data
| 0 | 1 | 3 | 7 | 14 | 30 | 60 | 90 | |
| Top 10 Apps | 100 | 74.67 | 71.51 | 67.39 | 63.28 | 59.80 | 55.10 | 50.87 |
| Next 50 Apps | 100 | 64.85 | 60.31 | 54.13 | 49.48 | 44.81 | 39.60 | 34.50 |
| Next 100 Apps | 100 | 48.72 | 42.96 | 35.93 | 30.79 | 25.45 | 21.25 | 18.98 |
| Next 5000 Apps | 100 | 34.31 | 28.54 | 21.64 | 17.43 | 13.62 | 10.74 | 8.99 |
| Average | 100 | 29.17 | 23.42 | 17.28 | 13.11 | 9.55 | 6.82 | 3.97 |
**Methodology
Some notes on methodology below, shared by Quettra:
PS. Get new updates/analysis on tech and startupsQuettra software, that currently resides on over 125M Android devices worldwide, collects install and usage statistics of every application present on the device. For this report, we examine five months of data starting from January 1, 2015.
Since we exclusively consider Android users in this study, we exclude Google apps (e.g. Gmail, YouTube, Maps, Hangouts, Google Play etc.) and other commonly pre-installed apps from our study to remove biases. We also only consider apps that have over 10,000 installs worldwide.
A note on privacy, which is very important to us: All data that we collected is anonymized, and no personally identifiable information is collected by any of our systems. From our understanding, this is the first time ubiquitous mobile application usage has been analyzed at such large scale. Quettra does not have a direct relationship with any of the apps or app developers mentioned in this report.
I write a high-quality, weekly newsletter covering what's happening in Silicon Valley, focused on startups, marketing, and mobile.