Archive for October, 2013
A clever way to buy Facebook ads based on what your users like (Guest post)
My friend Gagan Biyani wrote up a great piece how to analyze what your Facebook audience is interested in, and using that to buy ads. He’s generously shared it, below. Gagan is CEO and co-founder at Sprig, and before that was at Lyft and started up Udemy. You can follow him on Twitter at @gaganbiyani and he has a new Medium account here. -Andrew
Gagan Biyani, Sprig:
Building Target Groups for Facebook Ads
Facebook advertising is tricky and there are multiple facets to it. By far the most important value of Facebook is being able to target based on demographic information. In this post, I’ll show you exactly how to use the “affinity ratio” to figure out what Facebook likes to target and dramatically increase the performance of your Facebook advertising.
As mentioned above, you have to have Facebook Connect on your app and you must grab the likes of your users. A sample of your users is OK so even if Facebook Connect is merely one option amongst many, that’s fine.
(Credit: This method was created by my co-founder at Udemy, Eren Bali. We tested dozens of other forms of targeting and nothing came close. I’m sure there are many other companies that have come up with this on their own.)
Note: this only works if you have Facebook like data from your user base
Step 1: Figure out what Facebook pages your users like
Here’s the trick: Download a CSV of all of the unique facebook pages your users like and the COUNT() of the number of users who like each page. Example:

You’ll notice these numbers don’t make a whole lot of sense. That’s because I made them all up!
Notice a few things. First, this list is sorted by greatest # of likes. That list is already a bit useful — and probably something you’ve looked at before. The problem is it doesn’t make this data useful enough.Everyone and their mom’s likes Michelle Obama, so you can’t target your advertising that way. From here, you have to figure out which one of these pages is actually useful to you.
Second, if you have any reasonable-sized user base, you’ll probably have 1000’s of results on the left column. That’s fine but we’ll use a small list for this example. You may have to have some sort of COUNT() limit to make this easier (aka only pages with over 1,000 likes make the cut).
Step 2: Add in the “Global Likes” of those Facebook Pages
Now you need to figure out how many globlal likes each of the pages on your list has. Use the Facebook API or do it manually if you don’t have access to dev resources.
In our B.S. data set above, I went ahead and did it manually. Here’s the data:
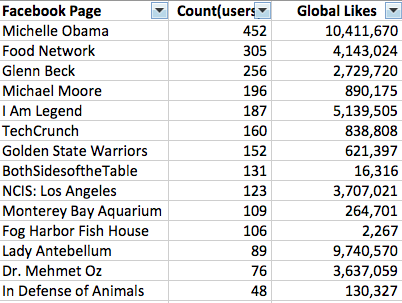
In case you’re wondering, I came up with this list by checking Facebook’s page recommendations. They were right on some things (who doesn’t like a little Dr. Oz in the mornings?) and wrong on others (phh, I don’t care about animals).It is probably starting to make sense now. Its not just about the total count of your users who like a given page, its actually about the relativecount.
Step 3: Create a ratio of [Count(users)]/[Global Likes]
From here, your goal is to create an “affinity score” (name created by Dinesh Thiru, who runs marketing at Udemy)
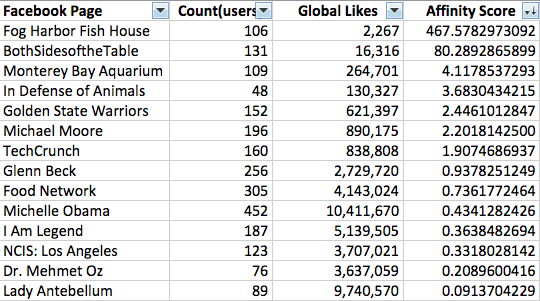
To make these numbers easier to read, I multipled the affinity score by 10,000. Depending on the number of users you have in Column Count(users), you may multiply by a smaller factor of 10.
Now, you have a relative score that allows you to compare different pages. I sorted this list by affinity score. Its interesting to see pages like “Michelle Obama” and “Food Network” to go from the top to the near-bottom of our list! Of course this is make-believe data, but when you have real data you’ll see similar results.
Step 4: Group your high affinity pages
Once you have a list of affinity scores, you need to group them into categories. This is important because otherwise, you wouldn’t have good Facebook targeting groups. Targeting users who like BothSidesoftheTable and the Golden State Warriors will make it hard to write ad copy and create cohesive campaigns.
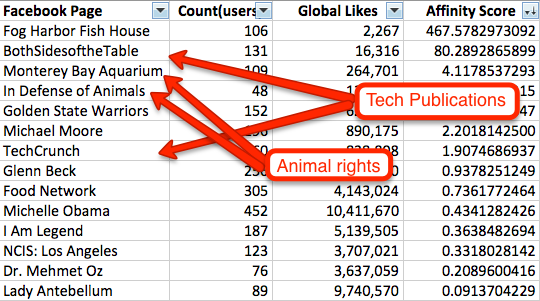 Natural groups will form when you start looking at your data.Two things matter when you are in the final stages of this:
- Sample size. The larger the size of your group, the more people you can target with your ads. You don’t want too large a size, though, because then you are paying crazy CPM’s and competing with a larger breadth of advertisers.
- Grouping. This is based entirely on your judgement. The natural groups are always ones where you think there’s a lot of overlap amongst those users. Its fairly obvious that people who like TechCrunch and BothSidesoftheTable overlap. In situations like the Monterey Bay Aquarium and In Defense of Animals group, its just a judgement call. Go with your gut.
- Expand your targeting using groups. As you create groups, it will be easy to start finding more users to target. So if you have tech blogs like TechCrunch on your list, you can add other ones such as PandoDaily, BusinessInsider and even CNet. Be careful though: there may be a reason your users don’t already like those pages. At Lyft and Udemy, we would use separate ad campaigns for “related” groups and monitor performance accordingly.
That’s a wrap folks. If you have questions, please feel free to ask and I’ll try to get to them.
P.S. This is why we started the Growth Hackers Conference and why I regularly read blogs like Andrew Chen’s or Sean Ellis’s. If you like this, I’ll also try to blog more to help share this kind of information. Tips like this used to be locked up in people’s heads — so poor entrepreneurs like me could never learn them. Now, you can pay $300 (with coupon code “FBadv”) and save months of time and thousands of dollars by going to conferences and reading blog posts about growth hacking. You might also find your next opportunity, meet a great candidate or connect with an industry insider who mentors you.
Use this spreadsheet for churn, MRR, and cohort analysis (Guest Post)
[Andrew: Christoph Janz has written some of the best essays on SaaS metrics and cohort analyses, and he was kind enough share the latest with us below. A bit about the author: Christoph is co-founder and Managing Partner at Point Nine Capital, an early-stage venture capital fund with a strong focus on SaaS investments. Their investments include Zendesk, FreeAgent, Clio, Geckoboard, Contactually and Unbounce. Christoph blogs here and is the creator of a popular SaaS metrics dashboard]
Christoph Janz, Point Nine Capital
Cohort Analysis Spreadsheet
If you’re a long-time reader of my blog (or if you know me personally) you’ll know that cohort analyses are one of my favorite tools for getting a deeper understanding of a product’s usage. Cohort analyses are also essential if you operate a SaaS business and want to know how you’re doing in terms of churn, customer lifetime and customer lifetime value. I’ve blogged about it before and have included “Ignore your cohorts” in my “9 Worst Practices in SaaS Metrics” slides.
My feeling is that over the last 12 months the awareness for the importance of cohort analyses has grown among startup founders. One reason may be that thought leaders like David Skok have been writing about the topic, another reason are web analytic tools like MixPanel and KissMetrics that make it simple to create cohort analyses.
And yet, many founders are still having difficulties with cohort analyses, be it with the collection of the data or the interpretation of the results. With that in mind I wanted to create a simple cohort analysis template for early-stage SaaS startups.
Download the Excel file here.
The idea is that you have to enter only a small amount of data and everything else is calculated automatically. Specifically, what you’ll have to type in (or import from a data source) is the basic cohort data: How many customers did you acquire in each month and how many of them were retained in each subsequent month. If you also want to see your churn on an MRR basis and get a sense for your CLTV, you’ll also have to enter the corresponding revenue numbers.
Get updates to this essay, plus more on cohort analysis and SaaS growth.
If you’re not sure how to read a cohort analysis, here’s a quick explanation:
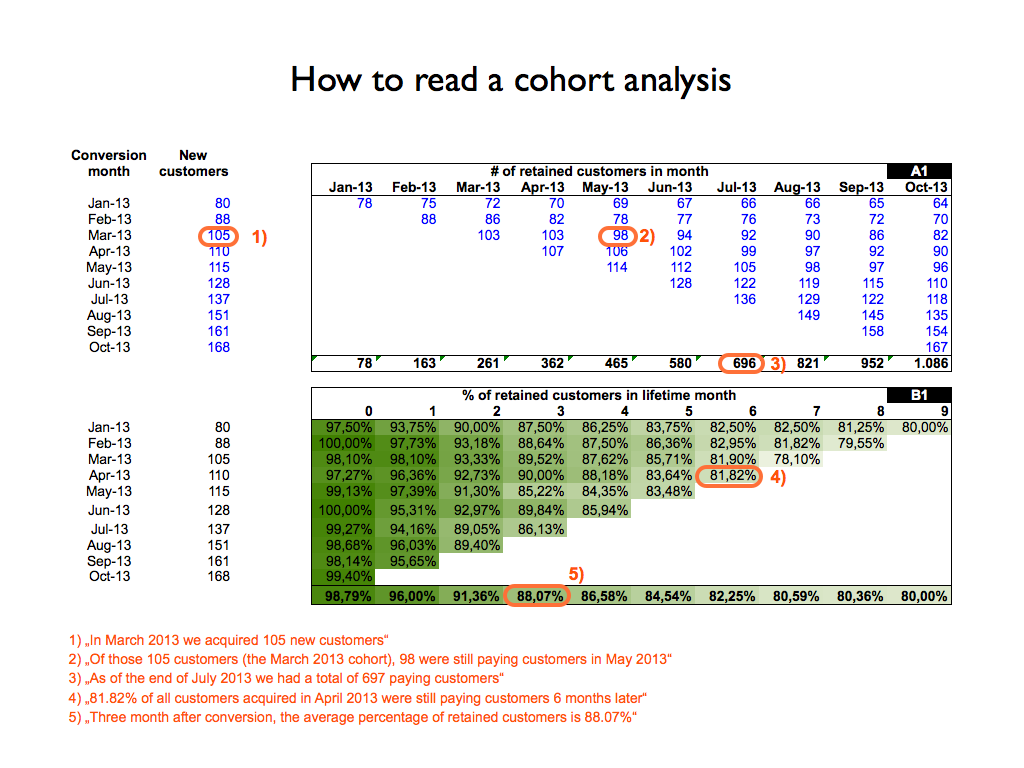
Here are some brief notes on each of the arrays in the sheet:
A1: This is where you enter the raw data. Start with January 2013 and enter the number of new customers that you’ve acquired in that month. Then move to the right and enter how many of those January 2013 customers were still customers in February, March, April and so on. Then move on to the next row. If your data goes further back than January 2013, extend the table accordingly.
A2 and A3: A2 takes the data from A1 and shows it in “left-aligned mode”, making it easier to compare different cohorts. As you can see the columns have changed from specific months to “lifetime months”. A3 shows the number of churned customers as opposed to the number of retained customers. Both A2 and A3 aren’t particularly insightful to look at per se, but the data is necessary for the calculations in B1, B2 and B3.
B1: Shows the percentage of retained customers, making it easy to see how retention develops over time as well as to compare different cohorts with each other. What you’ll want to see is that younger cohorts are getting better than older cohorts.
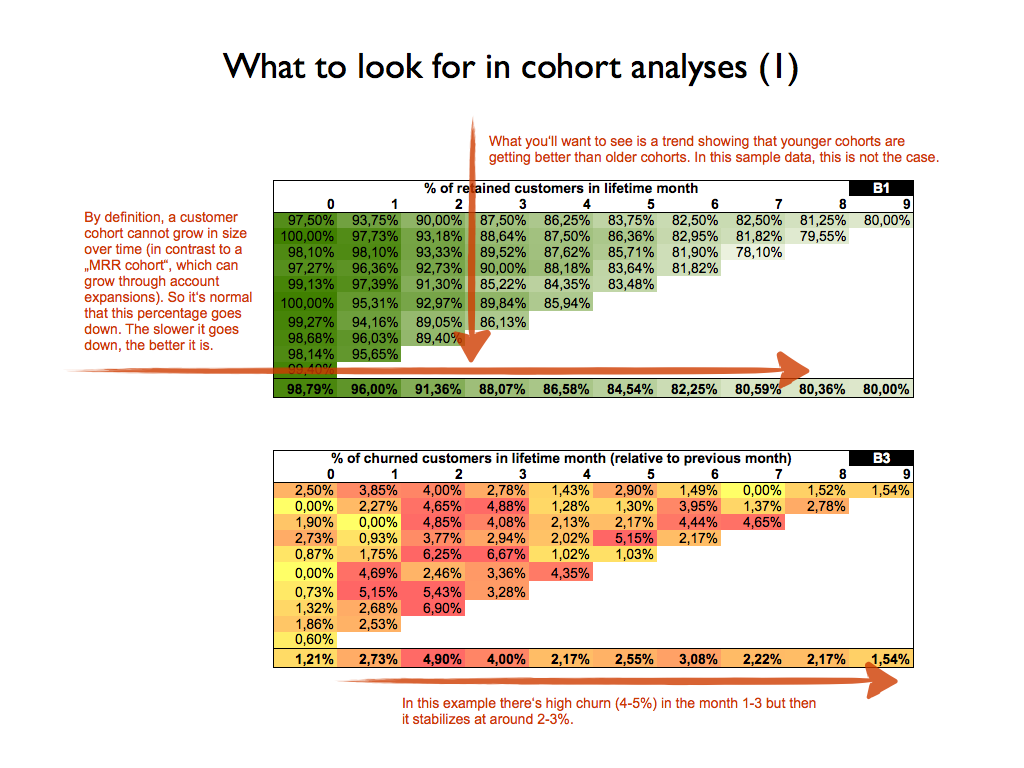
B2. This is kind of like the “inverse” of B1, showing the percentage of churned customers as opposed to the percentage of retained customers. In any given row, the sum of the percentages of churned customers plus the percentage of retained customers equals 100%.
B3: B3 is similar to B2, but the difference is that churn isn’t calculated relative to the original number of customers of the cohort but relative to the number of the cohort’s customers in the previous month. Let’s say you have a cohort with 100 customers and after 6 months the cohort has been reduced to 50 customers. If you lose 5 customers in month 7, this represents 5/100=5% churn in B2 but 5/50=10% churn in B3.
So what’s the correct number? There’s no right or wrong here, it depends on the question that you want to ask. If you want to know e.g. “How many customers do I lose within the first six months?”, B2 (in conjunction with B1) gives you the right answer. But if you want to know what percentage of customers you’re losing per month (important when you look at data across multiple cohorts and for lifetime estimates), take a look at B3.
What you’ll want to see in this table is that after a usually relatively high churn rate in the first lifetime months churn starts to stabilize (because the people who never really adopted the product in the first place are now gone).
C1-C3: Same as A1-A3, just for MRR instead of customer numbers.
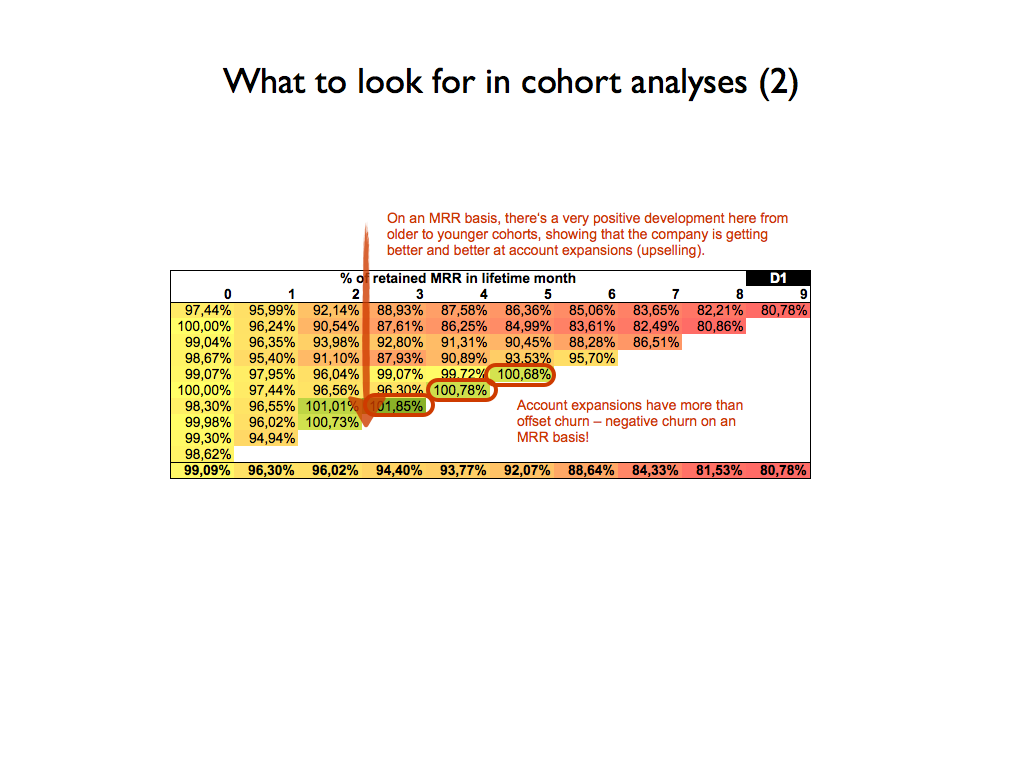
D1-D3: Same as B1-B3, just for MRR instead of customer numbers. What you’ll want to see is that your MRR churn is lower than your customer churn due to account expansions.
E1 and E2: If you enter the CACs for each cohort, these tables show you when each cohort breaks even.
Also take a look at the second tab in the Excel sheet, which calculates/estimates customer lifetime and customer lifetime value on a cohort basis. Note that the data is highly speculative for younger cohorts for which there isn’t much data yet.
Further notes are included in the Excel sheets.
If you have any questions or comments, please feel free to reach out!
Zero to Product/Market Fit (Presentation)
Readers,
Starting from a blank canvas is the absolute hardest thing to do. It’s insanely hard. And yet the brave entrepreneurs in the tech industry do it, time and time again, and every year, a few are successful. It’s an awesome thing when it works though.
Anyone who’s working on a new product has question: How do you get to product/market fit? If you’ve been wandering the desert and you can’t retain your users, is there anything you can do about that? Is there a way to add structure to something that seems awfully random? How do you even know you’re there?
Below is a short and sweet deck that I created and presented a few years back to Stanford students. It’s focused on a simple idea: The path from zero to product/market fit can be a straight line, or windy, depending on what kind of idea you choose. I present the tradeoffs involved in creating a product that’s a bit more incremental, versus something that’s more breakthrough.
Although this deck is mostly focused on consumer and consumery enterprise products, it’s also fairly general, drawing ideas from the book Blue Ocean Strategy and others.
Hope you enjoy!
Andrew
San Francisco, CA
Above: It’s difficult to product/market fit, but today we’ll talk about some of the tradeoffs you can make for it to be easier!
Traction is everything – it’s what investors ask for. It’s what prospective employees and your team is looking for. But getting traction is really a reflection of your product “working” – where users are engaged and retaining, and there’s some organic acquisition. Product/market fit is when people who know they want your product are happy with what you’re offering – more on the topic here at the a16z blog.
Above: Important, once you get to product/market fit, you can shift your focus from the initial product to distribution and win the market. It’s important to do it in this order! In the haste to get to market, there are teams that start spending too much time on partnerships, paid marketing, etc. – all in preparation for a big launch. But the problem is that if you have a leaky bucket, then all those users at the top of the funnel won’t help.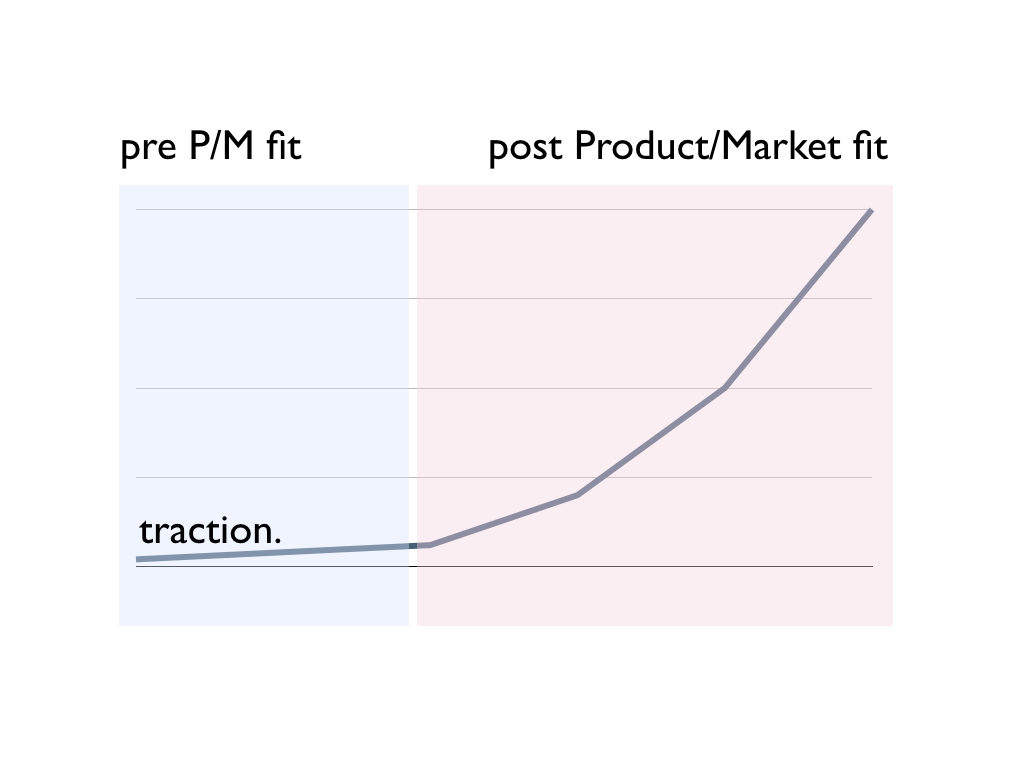
Above: So what does product/market fit look like from a metrics standpoint? Really the best metric to think about is probably retention, which you’d analyze using cohorts. That means it’s sticking, and you need to figure out acquisition. Once it’s all figured out though, then you get the hockey stick. That’s what we’re all looking for, right?
Hitting the inflection point means that you can focus on scaling growth. The activities here are many of the things that I write about – funnel optimization, new user activation, creating notifications and email drip campaigns, etc., etc.
But it’s important to think of these are distinct activities.
If your product isn’t working, you won’t solve that by doing growth activities.
There’s a certain lightning-in-a-bottle aspect to building new consumer companies for that reason.

This is why 20-something year olds often build awesome new companies in Silicon Valley- they make lots of stuff, hit product/market fit, and the capital/talent in the Bay Area comes to help them scale
Entrepreneurs who are young are less encumbered by the notion of “this is how things have always been done” or “this kind of thing has never worked.” They can try, fail, iterate, and make their way towards something pretty new.
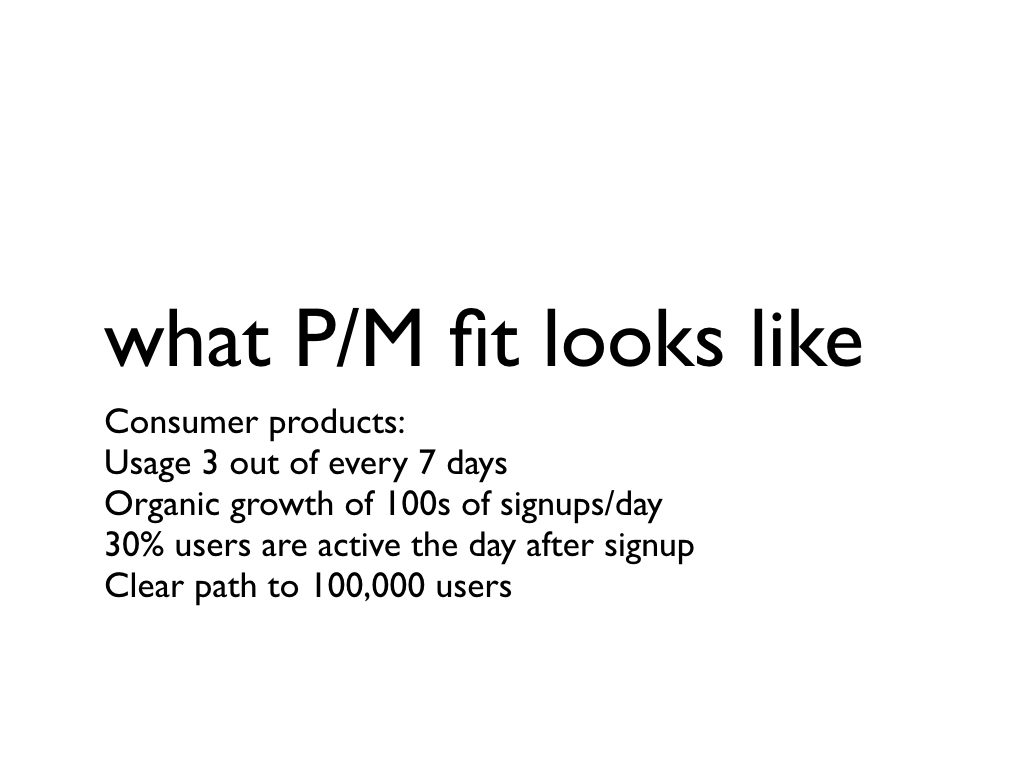
Above: Here are some specific ways that I might quickly judge if a consumer product has p/m fit.
You want to see DAU/MAU at >25%. A world-class leading DAU/MAU would be over 50%.
There’s a certain minimum for organic acquisition. You want to see hundreds if not thousands of signups per day, and a D1 of at least 30%. >70% would be world-class there.
And ultimately there’s some scale to show it works – probably 100,000 DAU.

For a SaaS product, you’d like at other metrics that might focus on monetization rather than engagement. Although some products can be evaluated using both sets of metrics.

Above: If you think you have that, send me an email :)
If you compare the metrics above, most startups don’t have product/market fit. It’s usually not working.
So what do you do?
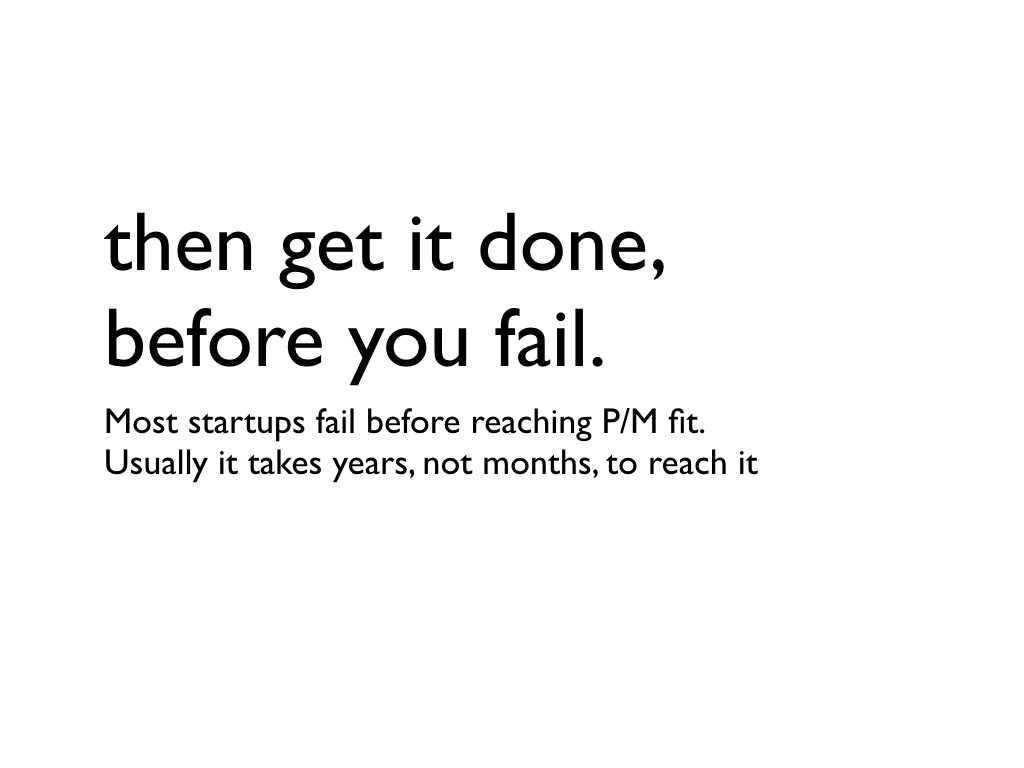
Above: These days, most startups fail because of lack of P/M fit, not technology risk. So if there’s one thing that will kill you, it’ll be the product never quite working, and thus, all the subsequent problems that come with that: Lack of investor interest, employees leaving, cofounder fighting, etc. It’s a stressful time when it’s not working
I find that product/market fit is usually reached either right away, or you have to be incredibly thoughtful about your iterations if you’re almost there but not quite.
So how do you get there?
Above: I want to present to you one framework to think about this, and what kinds of tradeoffs you can make.

Above: Here’s a coffee cup. Product/market fit is actually easy to get, for a coffee cup. It has to hold coffee. That’s about it. There’s not too many variables in designing a cup, and so there’s not a lot to mess up.

Above: Contrast that to a digital product, where there are a million variables. It’s so much more complex than a coffee cup! It’s easy to mess something up.
(The above is a Facebook experimental project, called Paper, that never quite worked out)
It’s easy to mess up because the software medium is so rich. You can build or create anything, and you often end up with something that users can’t quite understand. Worst yet, once it’s not working, adding features won’t help! Sometimes the foundation is just not strong.
Keep these examples in your head, as two extremes on a spectrum. The coffee cup. The messy random digital product.

Above: The more I’ve thought about this problem, the more I’ve come to realize there’s really a spectrum between new versus pre-existing product categories.
The new product category carries a lot more risk, which we’ll discuss.
The pre-existing category carries less risk, but you face more competition, more expectations, etc.
What you want is a point in between those two extremes.
First, over time I’ve come to believe that you actually do want your product to be in a pre-existing product category. Google was not the first search engine, Facebook was not the first social network, and Microsoft was not the first OS.
However, those companies came to dominate those markets because they came in early, when the dynamics were still developing. And the markets grew and grew. But it was also clear what they offered, how they developed something killer.
Above: I want to be more precise than to say that the market must be big – more specifically than that, there must be a large number of users who are pulling on this category in the market. By pulling, I mean folks are actively searching for the product. You can see it in Google Trends. They are clicking on links that mention products in the category. There’s already spend.
Let’s contrast this to the big fake market sizes that entrepreneurs often trick themselves into. Yes there are a lot of college students, and maybe that’s your target market. But how many of them actually want this? Already own a precursor version of your product, or are googling or searching or talking about the category? That’s the real assessment of demand.
Above: Related to the above point, the best markets already have competitors. And maybe they are pretty decent. It’s a good sign when folks can make a decent living building products in the space, but you just have to find a wedge to get in. Or maybe you have a clear thesis on why and how the market will get a lot bigger quickly.
The best case is where the market is large, but fragmented – perhaps because the competitors are not that competent or there’s something structural, like regulatory issues, that keep things small.
Above: If you are in a pre-existing market with competitors and pre-existing demand, then you need a wedge. You need to analyze the market, understand the segments, and figure out how to break in.
My favorite book on this topic is Different: Escaping the Competitive Herd. Worth reading.

Above: There’s a huge advantage to building for yourself because the intuitive advantage it gives you in iterating quickly is fantastic. This isn’t always possible, but it can be a good thing.

Just as we discussed with the coffee cup, one way to get to product/market fit quickly is to just copy something.
There are a ton of problems with this strategy though – if you’re the second player with the same product, you’ll always remain the second player. Your team will hate this strategy. Investors won’t get it.
Sometimes the market is big enough to make this work, but it’s not often.

Above: The better approach is to do a twist. On the spectrum of pre-existing market to new market, pick a point in the middle. Build something that consumers fundamentally understand, but with a clear innovation that you can market around.
A lot of getting to product/market fit is being thoughtful about the category, the axis of differentiation, etc.

I want to run through some common mistakes that people make.
Above: We love these “X for Y” type companies. And it can be a way to generate cool ideas, but it doesn’t say much about the underlying market size and existence of pull in the market.
For instance, “Pinterest for dogs” and “Pinterest for businesses” are both X for Y ideas, but only dogs are a segment of Pinterest. A business-targeted product is more a description of the mechanics of the product, not a smaller set of the broader Pinterest market. And as we mentioned, identifying a wedge in a pre-existing market is key.
As a result, you can think about existing versus new markets using The Substitution Test. If I use this new product you’re building, does it take away engagement or $ from something else. If so, then it’s truly a segment and a heads-on competitor. It’s counter-intuitive but I consider that a good thing, because they you are truly competing in a pre-existing framework- you just need the right functionality to win.
Above: Every existing market has a baseline of product quality, functionality, etc. We’d all love to build the minimum viable product, but sometimes it doesn’t work because the category has evolved sufficiently that you need more than the bare bones.

Sometimes people love a certain kind of tech. Today it might be crypto, tomorrow it might be something else. And they are looking for some kind of product and category to apply to, rather than fundamentally solving peoples’ core needs. It’s an easy mistake to make for technologists.

As you know, I hate new consumer behavior :) Sometimes this can work but it’s rare. At the very least, products have to tap into the same fundamental human motivations that have driven us for 100,000s of years.

Above: This is a San Francisco thing, but entrepreneurs are often building things that sound cool only to each other. No one else cares, but it’s fun and captures some tech trend that’s confined to the SOMA bubble. I call this “art for artists”
Above: This is common. You can execute everything correctly – iterate quickly, great tech, hire well, etc. – but ultimately still take huge risks on your product and market in such a way to not actually be successful.

Above: So let’s say you get something that has P/M fit, and it starts to take off! It’s a good problem to have. So what do you do?
Above: Luckily, you can summon the power of the Bay Area to help you solve this.
There’s a large body of work and experts on scaling companies. You can raise money, hire operators who’ve scaled, and you’re on your way.
I don’t mean to downplay this, except to say that the zero to product/market fit part is so hard that this next stage will be much easier than the first. Ultimately, there’s a few growth channels that work, and it’s much more of an optimization problem.
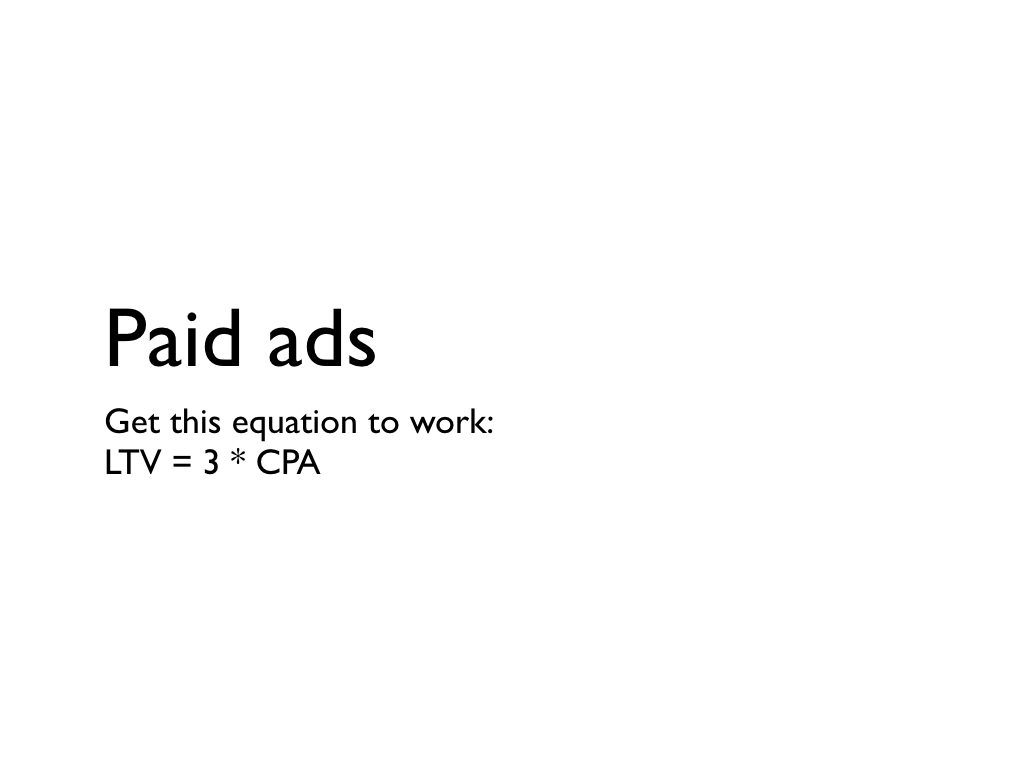
Above: For the paid ads channel, you’re ultimately looking at it as a LTV versus CAC problem. With some blended/organic traction too.
The ecommerce companies, OTAs, and marketplaces often grow like this.

Or you want to build a viral loop – if your product is social or collaborative in nature – and you can optimize for invites or content sharing or some other loop. This is a deep topic that could be a multi-part series of its own things.
This channel is used by the social networks, video sharing products, but also even productivity/collaboration products in the workplace.

If your growth loop involves a lot of user-generated content, then you can build on Google. For products that are really about reviews on local businesses, companies/products, or even real estate, we see them use this loop.

Above: If you’re at product/market fit, I want to hear from you! Send me a note anytime. Thank you :) (For future reference, you can also download the PDF here).
The Rise of Fat Venture Capital

Reinventing the VC industry
In 2007, before YCombinator and AngelList had changed the industry, I worked in a nondescript office park in the heart of the venture capital industry off Sand Hill Road. Amid the leafy sprawl of buildings next to 280 and Stanford University, billions of dollars were and are invested out of the fancy offices of VC/PE firms you’ve never heard of. The whole industry has been shrouded in opaqueness since it was created decades ago, built on relationships from business schools, professional networks, and investor referrals. In 2007, I worked at a big firm as an Entrepreneur-in-Residence, and did my best to make sense of this world.
The first thing I noticed was that the venture capital industry seemed so opaque as to be self-defeating. Entrepreneurs didn’t know who to talk to, and most can’t name more than 2 or 3 firms. While venture capitalists would pontificate about the importance of differentiation, all of their websites consisted of a bunch of blue-shirted dudes that all invested in the same stuff. This always confused me.
I remember at one point I had lunch with a General Partner of a Sand Hill firm and we talked about PR:
Me: So why don’t VCs do more PR?
General Partner: Great entrepreneurs know to come to us. We don’t have to go to them. And in fact, having great investment returns and being out there in the public don’t really correlate, so we don’t do it.
It sorta made sense to me then. This approach had been true for the first few decades of the venture capital industry. Getting ahold of a GP through an entrepreneur’s network seemed like a basic test of competence.
Thus, other than raising the money, you didn’t need much overhead to run a VC. You just needed a couple guys in a nice office, 1 admin per partner, and a website. If you wanted to get fancy, you could have a venture partner or associate or two. Maybe 6 professionals plus their admin staff.
But just a few years later, in 2013, we now see VC firms with over 80 professionals. Not just one, but multiple firms are doing this. And even small funds are experimenting with events, content marketing, software infrastructure, etc.
This is the new era of “Fat Venture Capital.”
How did this happen?
Lots of trends driving differentiation of capital
There’s a lot of trends driving VCs to differentiate. The obvious stuff: It’s cheaper to start a company. There’s more seed money, in the form of both accelerators writing $20k checks and seed funds writing $500k checks. There’s a lot more information out there, for both what firms to pitch and what terms to expect. There’s been a lot of great material covering the trends affecting startups so I won’t elaborate more here.
What’s less frequently discussed has been the recent trends on the venture capital side. A lot of firms decided that the high market risk, low tech risk nature of digital bets meant that they needed to employ a “barbell” strategy. Lots of seed stage investments, plus lots of late-stage investments, and not much in-between. Many early firms that traditionally would lead Series As and then hand off the larger “late stage venture capital firms” now see themselves playing at every stage. But if you wait to do later stage bets, then the traction is more obvious, and there’s more head-to-head competition between firms as they chase obvious deals. More head-to-head competition means that differentiation matters.
Similarly, the lower capital requirements of startups means that there’s been a lot of new firms started recently. It’s a lot easier for some successful startup execs to start a new VC fund by raising $20M or $50M, rather than a traditional VC that raises $200M or more. This has brought a lot of entrepreneurial energy to a sector that often behaves like a sleepy money management industry, rather than the dynamic startups in which they invest.
This entrepreneurial energy is especially important in an industry where the guys who invented the industry are now long retired. When you read books or watch documentaries about the early VC industry, you can see that the early guys who knocked on the doors of insurance companies in the midwest were truly entrepreneurs. Years later, many firms are led by professional investors who are two generations removed from these early innovators. While the successful-entrepreneur-turned-VC is still widely admired, plenty of firms are stocked with MBAs-turned-associates-turned-VCs, who are prone to view VC as a career rather than an competitive and entrepreneurial endeavour in itself.
And of course, many large firms are simply reacting to the competitive pressure from Andreessen Horowitz. They popularized this services-based approach and this WSJ interview is worth reading about their approach. The CAA analogy is particularly insightful.
The unbundling of the General Partner
The impact for entrepreneurs is straightforward. It used to be that an investment from a General Partner of a VC was a bunch of things bundled together:
- Money
- Expertise
- Oversight
- Professional network
These days, we’re moving to a model where this all gets unbundled. Money comes from the VC, but also from a long list of investors sourced from crowd funding platforms. The professional network for a firm is supported by a large services team. Advice can come from a long list of advisors and operational folks that are easy to track down on LinkedIn. Functions like executive recruiting, technical recruiting, PR, etc. don’t come from the particular GP who wrote the check, but rather, the services team that works for them. Instead of the GP sending you random links they’ve read, instead there’s dashboards and link-sharing services that are private amongst the other portfolio companies of the investor.
Furthermore, we’ll see the internal functions of a VC firm, like marketing, evolve to be pointed towards entrepreneurs rather than investor management. Instead of press releases on PEHub, we’ll see firms act more like SaaS marketers: Content marketing, professional events, even paid advertising. Why shouldn’t a VC firm be buying Facebook ads targeted at the next crop of Stanford CS graduates?
Ultimately great VCs will continue to do well. Many won’t embrace the Fat Venture Capital model, but will do fine, because their judgement, expertise or network is just that good. But for the rest of the industry, moving to differentiate will be the norm.
Entrepreneurs will benefit. More transparency and competition will mean that the “the good ones will come to us” attitude will be a thing of the past. Instead, great VCs will chase the great entrepreneurs, because in a world where the supply of great entrepreneurs is smaller than the supply of plain ol’ money, that’s the way it should be.
How Google and Zynga set & achieve meaningful OKRs (Guest Post)
[The topic of setting goals, especially quantitative ones, is a really important topic for any team and any startup. A common format has been the OKR, or “Objectives and Key results” which is in use at Google, Zynga, and many other companies. It consists of setting an objective, and also a series of measurable results aligned with that objective. My good friend Kenton Kivestu, (now Flurry but previously Zynga and Google) has experienced this framework first hand and had a lot of insightful stuff to say about it. You can follow Kenton on Twitter and read his blog here. -Andrew]
Kenton Kivestu, Flurry:
How to set & achieve meaningful OKRs
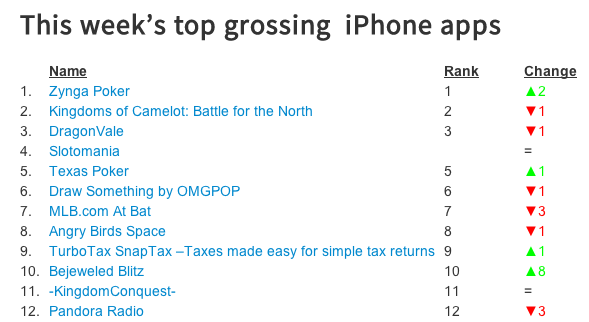
In 2011, when I joined Zynga to work on the mobile poker franchise, we were getting trounced by a competitor named Texas Poker. Their UX was better. They were smoking us on appstore top grossing rankings. And they had 5x the features (not to mention a “premium” pro version of the game they’d just launched). For a company who unequivocally dominated the poker space on FB, our position in the mobile poker market was borderline comical.
The team set an OKR to take the throne: become the #1 top grossing iOS poker game. And then something incredible happened, we did (~6 months later). In my career, I’ve seen many an OKR go haywire (both at Google and Zynga) so this post is my attempt to distill & isolate the common traits I’ve seen in good implementations of an OKR.
First, what is an OKR and why bother?
Google has used OKRs since 1999 at the urging of KPCB partner John Doerr and Rick Klau (former Googler, now Google Ventures partner) has a good post on what is an OKR is (and it’s history). And you can read up on them at Quora too. But the TL;DR is an OKR is a stated goal, known to the whole company and has a pre-defined rubric to measure your success in achieving it.
Whether your at a start-up or big co, the only thing in endless supply is constraints. Time, developer resources, energy and the list goes on. And in a resource constrained world, the best plan of attack is to marshall resources and focus efforts on the best leverage point.
Now the question is, how do you set good OKRs? Like all things, there are many ways to successfully skin a cat but the 3 most common traits I’ve seen in teams that have set and achieved awesome results with OKRs are these:
Measurable
Contrary to popular belief, this doesn’t mean the the OKR needs to be explicitly quantitative (eg drive X% increase in sign-ups or Y% year over year growth in recurring revenues), although it’s fine if that is the case. But it definitely needs to be measurable in the sense that the team can unequivocally evaluate their progress at the end of the OKR period.
For us, the iOS app store Top Grossing rankings were our measuring stick (for better or worse). There was no fudging the numbers and it was dead simple to measure, we were either ahead or behind.
Focused
OKRs are like money. Mo’ money, mo’ problems. The surest way to negate any positive impact from a good OKR is to set 10 good OKRs. It can seem alluring at first – “we’ll accomplish so many things this quarter/year!” – but it will backfire. There is little doubt that 10 good OKRs is worse than nothing. Your team will be torn between competing priorities – should John the engineer work on X or Y this sprint? One will get us closer to OKR A and the other toward OKR B. Inevitably this leads to prioritizing OKRs – this might work if you have 1 or 2 but anymore than that is going to be a recipe for a wasted quarter.
For us, we had 1. If a feature/chunk of work didn’t directly contribute to us climbing the iOS top grossing rankings, it was de-prioritized. As a result, we got a late start on expanding to other platforms (Android tablets, Kindle Fires). That was painful but the focus brought the right end result, since the iOS Top Grossing “pot o’ gold” was orders of magnitude more rewarding than early adoption of Fire or And tablets.
Worth doing
Again, this seems obvious but is worth stating. A good sanity test is ask yourself, “If the company were a person, would it put the successful completion of this OKR on its resume?” If the answer is no, boot it. All too often well-intentioned but “empty” OKRs end up dictating resource allocation. These culprit OKRs typically rise out of a discussion around some product tactics (eg let’s reduce friction in the sign-up flow by X%).
Ok, but OKRs stunt our creativity
An oft argued counterpoint is that OKRs will stunt creativity and the team’s ability to tinker and meander into some great discovery. Defenders of this theory highlight examples of accidental discoveries leading to huge innovations – but this is missing the point. OKRs don’t preclude accidental discoveries, they simply make sure that in absence of a brilliant accident the team is on track to do something else meaningful.
If you’re finding your team sets quarterly OKRs only to trash them each quarter given a brilliant mid-quarter discovery, you’re either:
- a 2-sigma team that repeatedly launches industry leading core features every quarter despite not initially planning them
- setting OKRs not “worth doing” as evidenced by repeated willingness to ditch them
- unfocused and need more operational discipline
In conclusion
OKRs are not a panacea. And they can lead a team astray if they don’t keep them focused, measurable and meaningful. But the flip side is that a well-set OKR can generate a 10x result. OKRs can drive focus and relentless execution, and in turn, those drive incredible results.