Archive for November, 2018
What’s next for marketplace startups? Reinventing the $10 trillion service economy, that’s what.
[Dear readers, this essay is on the future of marketplaces. Is there still room for marketplace startups to innovate? We answer, emphatically, yes! Am excited to share a vision on the past and future of the service economy, in a collaboration by my a16z colleague Li Jin. From “Unbundling Craiglist” to “Uber for X” – we lay it all out in a single framework. Hope you enjoy our thinking! -A]
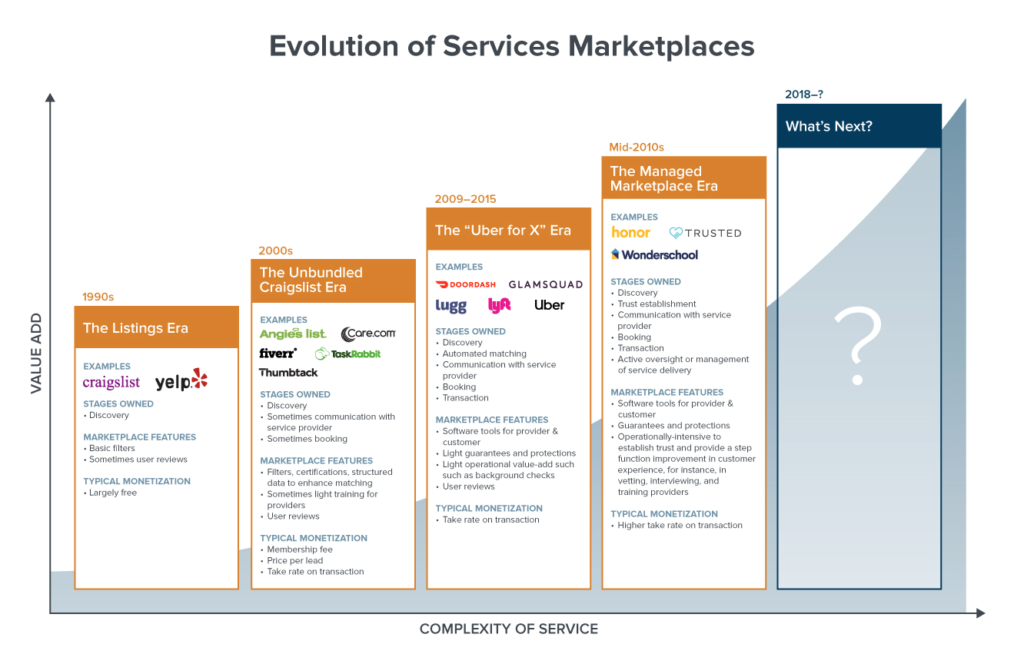
Above: 4 eras of marketplaces focused on the service economy – and what’s next
Goods versus Services – why a breakthrough is coming
Marketplace startups have done incredibly well over the first few decades of the internet, reinventing the way we shop for goods, but have been less successful services. In this essay, we argue that a breakthrough is on its way: While the first phase of the internet has been about creating marketplaces for goods, the next phase will be about reinventing the service economy. Startups will build on the lessons and tactics to crack the toughest service industries – including regulated markets that have withstood digital transformation for decades. In doing this, the lives of 125 million Americans who work in the services-providing industries will join the digital transformation of the economy.
In the past twenty years, we’ve transformed the way people buy goods online, and in the process created Amazon, eBay, JD.com, Alibaba, and other e-commerce giants, accounting for trillions of dollars in market capitalization. The next era will do the same to the $9.7 trillion US consumer service economy, through discontinuous innovations in AI and automation, new marketplace paradigms, and overcoming regulatory capture.
The service economy lags behind: while services make up 69% of national consumer spending, the Bureau of Economic Analysis estimated that just 7% of services were primarily digital, meaning they utilized internet to conduct transactions.
We propose that a new age of service marketplaces will emerge, driven by unlocking more complex services, including services that are regulated. In this essay, we’ll talk about:
- Why services are still primarily offline
- The history of service marketplace paradigms
- The Listings Era
- The Unbundled Craigslist Era
- The “Uber for X” Era
- The Managed Marketplace Era
- The future of service marketplaces
- Regulated services
- Five strategies for unlocking supply in regulated markets
- Future opportunities
Let’s start by looking at where the service economy is right now and why it’s resisted a full scale transformation by software.
Software eating the service economy, but it’s been slow
We’ve all had the experience of asking friends for recommendations for a great service provider, whether it be a great childcare provider, doctor, or hair stylist. Why is that? Why aren’t we discovering and consuming these services in the same digital way we’ve come to expect for goods?
Despite the rise of services in the overall economy, there are a few reasons why services have lagged behind goods in terms of coming online:
- Services are complex and diverse, making it challenging to capture relevant information in an online marketplace
- Success and quality in services is subjective
- Fragmentation – small service providers lack the tools or time to come online
- Real-world interaction is at the heart of services delivery, which makes it hard to disaggregate parts of a purchase that might be done online
Let’s unpack each reason below:
First, on the complexity and diversity of services, services are performed by providers who vary widely, unlike goods which are manufactured to a certain spec. Even the names of services can vary: what one home cleaning service calls a “deep clean” can be different from another provider’s definition. This lack of standardization makes it difficult for a service marketplace to capture and organize the relevant information.
Second, services are often complex interactions without a clear yardstick of success or quality. The customer experience of a service is often subjective, making traditional marketplace features like reviews, recommendations, and personalization more difficult to implement. Sometimes just getting the job completed (as in rideshare) is sufficient to earn a 5-star review, whereas other higher-stakes services, like childcare, have complex customer value functions, including safety, friendliness, communicativeness, rapport with child, and other subjective measures of success.
Third, small service providers often lack the tools or time to come online. In many service industries, providers are small business owners with low margins; contrast this with goods manufacturing where there are economies of scale in production, and thus consolidation into large consumer products companies. As a result of industry fragmentation, service providers often don’t have time or budget to devote to key business functions, such as responding to customer requests, promoting and marketing themselves, maintaining a website, and other core functions. While major e-commerce platforms have taken on the role of distribution, merchandising, and fulfilling orders for goods, there are few platforms that service providers can plug into to manage their businesses and reach customers.
Fourth, real-world interaction is central to services, which can pull other steps of the services funnel into the offline world as well. Many services are produced and consumed simultaneously in real-world interactions, whereas goods entail independent stages of production, distribution, and consumption. The various stages of the goods value chain can be easily unbundled, with e-commerce marketplaces comprising the discovery, transaction, and fulfillment steps. Conversely, since the production and consumption of services usually occur simultaneously offline, the discovery, distribution, and transaction pieces are also often integrated into the offline experience. For instance, since getting a haircut entails going to a salon and having interactions with the providers there, the stages of the value chain that precede and follow that interaction (discovery, booking, and payment) also often get incorporated into the in-person experience.
All of these factors make it very hard for services to come online as comprehensively and widely as commerce – but there’s hope. We’ve seen multiple eras of bringing the service economy online, and we’re on the verge of a breakthrough!
The 4 eras of Service Marketplaces, and what’s next
There have been 4 major generations of service marketplaces, but coverage of services and providers remains spotty, and many don’t provide end-to-end, seamless consumer experiences. Let’s zoom out and talk through each historical marketplace paradigm, and what we’ve learned so far.
Above, you can see that there have roughly been four major eras of marketplace innovation when it comes to the service economy.
1. The Listings Era (1990s)
The first iteration of bringing services online involved unmanaged horizontal marketplaces, essentially listing platforms that helped demand search for supply and vice versa. These marketplaces were the digital version of the Yellow Pages, enabling visibility into which service providers existed, but placing the onus on the user to assess providers, contact them, arrange times to meet, and transact. The dynamic here is “caveat emptor”–users assume the responsibility of vetting their counterparties and establishing trust, and there’s little in the way of platform standards, protections, or guarantees.
Craigslist’s Services category is the archetypal unmanaged service marketplace. It includes a jumble of house remodeling, painting, carpet cleaners, wedding photographers, and other services. But limited tech functionality means that it feels disorganized and hard to navigate, and there’s no way to transact or contact the provider without moving off the platform.

We’ve all had the experience of a listings-oriented product, like Craigslist. You find something you want, but everything else – trust/reviews/payments/etc – that’s all up to you!
2. The Unbundled Craigslist Era (2000s)
Companies iterated on the horizontal marketplace model by focusing on a specific sub-vertical, enabling them to offer features tailored to a specific industry. We’ve all seen the diagram of various companies picking off Craigslist verticals – it looks something like this:
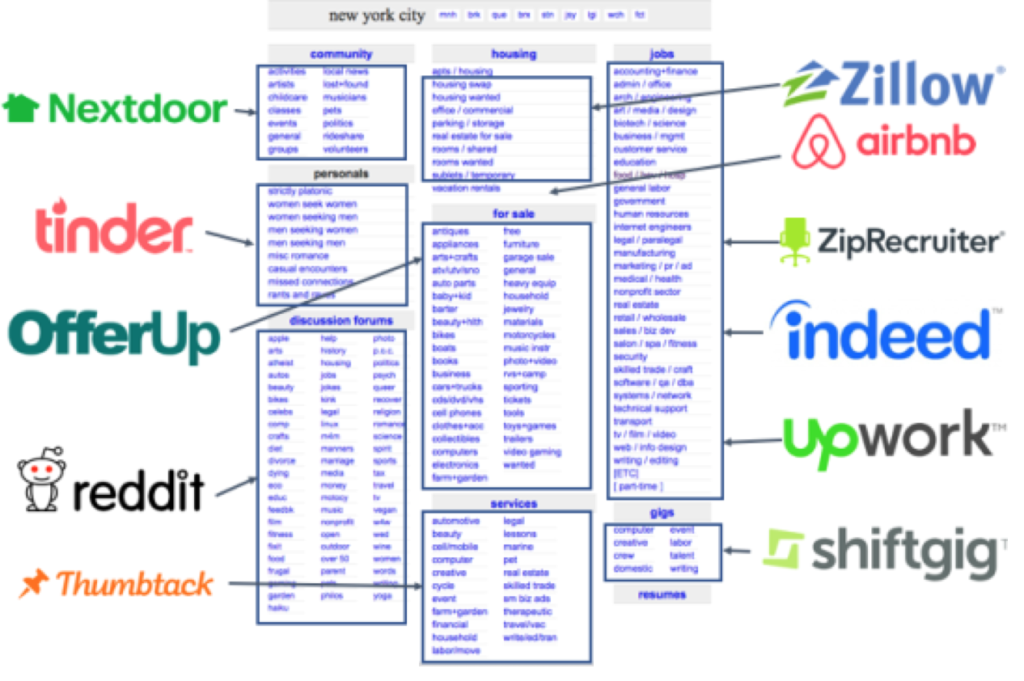
As a reaction to the “Wild West” nature of Craigslist, to improve the customer experience, each startup would create value-add via software. For instance, Care.com carves off the Childcare section of Craigslist, and provides tech value-add in the form of filters, structured information, and other features to improve the customer experience of finding a local caregiver. It’s a huge leap in terms of user experience over Craigslist’s Childcare section.

Angie’s List, a home services site founded in 2005, carves off Craigslist’s household services category. The platform has features including reviews, profiles, certified providers, and an online quote submission process. But the marketplace doesn’t encompass the entire end-to-end experience: users turn to Angie’s List for discovery, but still need to message or call providers and coordinate offline.
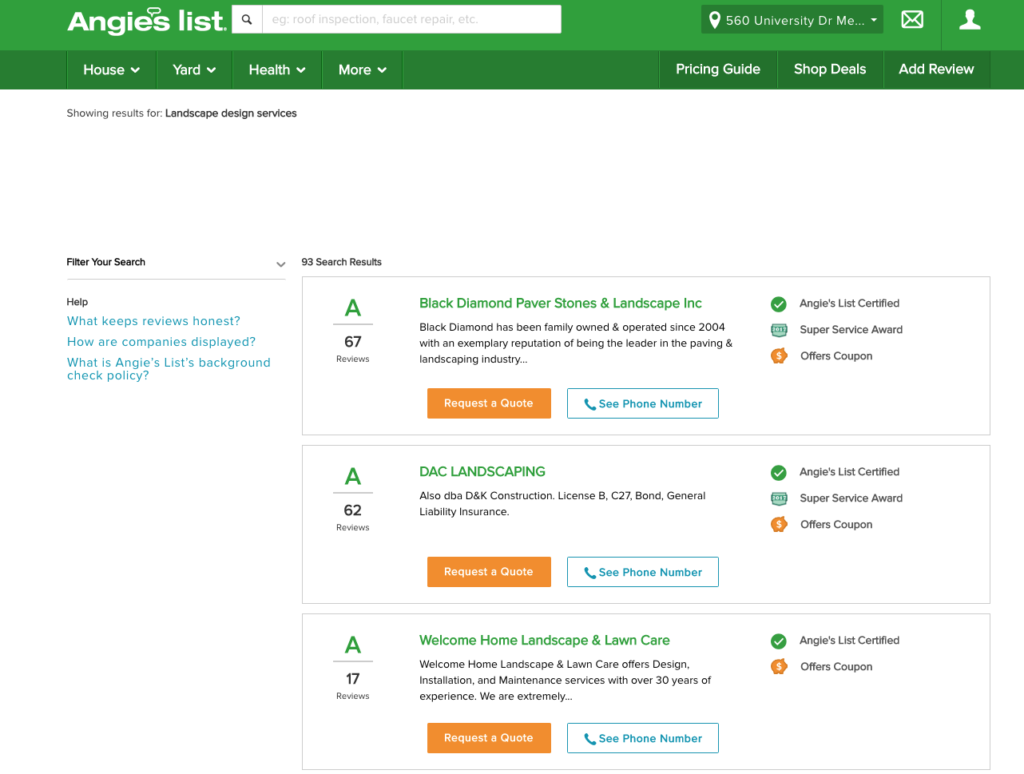
Unmanaged vertical marketplaces like Angie’s List go a step beyond Craigslist and take on some value-add services like certifying providers when they meet certain standards, but customers still need to select and contact the service provider, place their trust in the provider rather than the platform, and transact offline.
Like previous listing sites, these platforms in this era try to use the ‘wisdom of the crowds’ to promote trust. These platforms have a network effect in that more reviews means more users and more reviews. But user reviews have their limitations, as every user has a unique value function that they’re judging a service against. Without standardized moderation or curation, and without machine learning to automate this process, customers have the onus of sifting through countless reviews and selecting among thousands of providers.
3. The “Uber for X” Era (2009-)
In the early 2010s, a wave of on-demand marketplaces for simple services arose, including transportation, food delivery, and valet parking. These marketplaces were enabled by widespread mobile adoption, making it possible to book a service or accept a job with the tap of a button.


Companies like Handy, Lugg, Lyft, Rinse, Uber and many others made it efficient to connect to service providers in real-time. They created a full-stack experience around a particular service, optimizing for liquidity in one category. For these transactions, quality and success were more or less binary–either the service was fulfilled or it wasn’t–making them conducive to an on-demand model.
These platforms took on various functions to establish an end-to-end, seamless user experience: automatically matching supply and demand, setting prices, handling transactions, and establishing trust through guarantees and protections. They also often commoditized the underlying service provider (for instance, widespread variance on the driver side of rideshare marketplaces is distilled into Uber X, Uber Pool, Uber Black, Uber XL, etc.).
Unlike the previous generations of marketplaces, in which the provider ultimately owns the end customer relationship, these on-demand marketplaces became thought of as the service provider, e.g. “I ordered food from DoorDash” or “Let’s Uber there,” rather than the underlying person or business that actually rendered the service.
Over time, many startups in this category failed, and the ones that survived did so by focusing on and nailing a frequent use case, offering compelling value propositions to demand and supply (potentially removing the on-demand component, which wasn’t valuable for some services), and putting in place incentives and structures to promote liquidity, trust, safety, and reliability.
4. The Managed Marketplace Era (Mid-2010s)
In the last few years, we’ve seen a rise in the number of full-stack or managed marketplaces, or marketplaces that take on additional operational value-add in terms of intermediating the service delivery. While “Uber for X” models were well-suited to simple services, managed marketplaces evolved to better tackle services that were more complex, higher priced, and that required greater trust.
Managed marketplaces take on additional work of actually influencing or managing the service experience, and in doing so, create a step-function improvement in the customer experience. Rather than just enabling customers to discover and build trust with the end provider, these marketplaces take on the work of actually creating trust.
In the a16z portfolio, Honor is building a managed marketplace for in-home care, and interviews and screens every care professional before they are onboarded and provides new customers with a Care Advisor to design a personalized care plan. Opendoor is a managed marketplace that creates a radically different experience for buying and selling a home. When a customer wants to sell their home, Opendoor actually buys the home, performs maintenance, markets the home, and finds the next buyer. Contrast this with the traditional experience of selling a home, where there is the hassle of repairs, listing, showings, and potentially months of uncertainty.

Managed marketplaces like Honor and Opendoor take on steps of the value chain that platforms traditionally left to customers or providers, such as vetting supply. Customers place their trust in the platform, rather than the counterparty of the transaction. To compensate for heavier operational costs, it’s common for managed marketplaces to actually dictate pricing for services and charge a higher take rate than less-managed marketplace models.
Managed marketplaces are a tactic to solve a broader problem around accessing high-quality supply, especially for services that require greater trust and/or entail high transaction value. If we zoom out further, there’s many more categories of services that can benefit from managed models and other tactics to unlock supply.
What’s next: The future of Service Marketplaces (2018-?)
We think the next era of service marketplaces have potential to unlock a huge swath of the 125 million service jobs in the US. These marketplaces will tackle the opportunities that have eluded previous eras of service marketplaces, and will bring the most difficult services categories online–in particular, services that are regulated. Regulated services–in which suppliers are licensed by a government agency or certified by a professional or industry organization–include engineering, accounting, teaching, law, and other professions that impact many people’s lives directly to a large degree. In 2015, 26% of employed people had a certification or license.
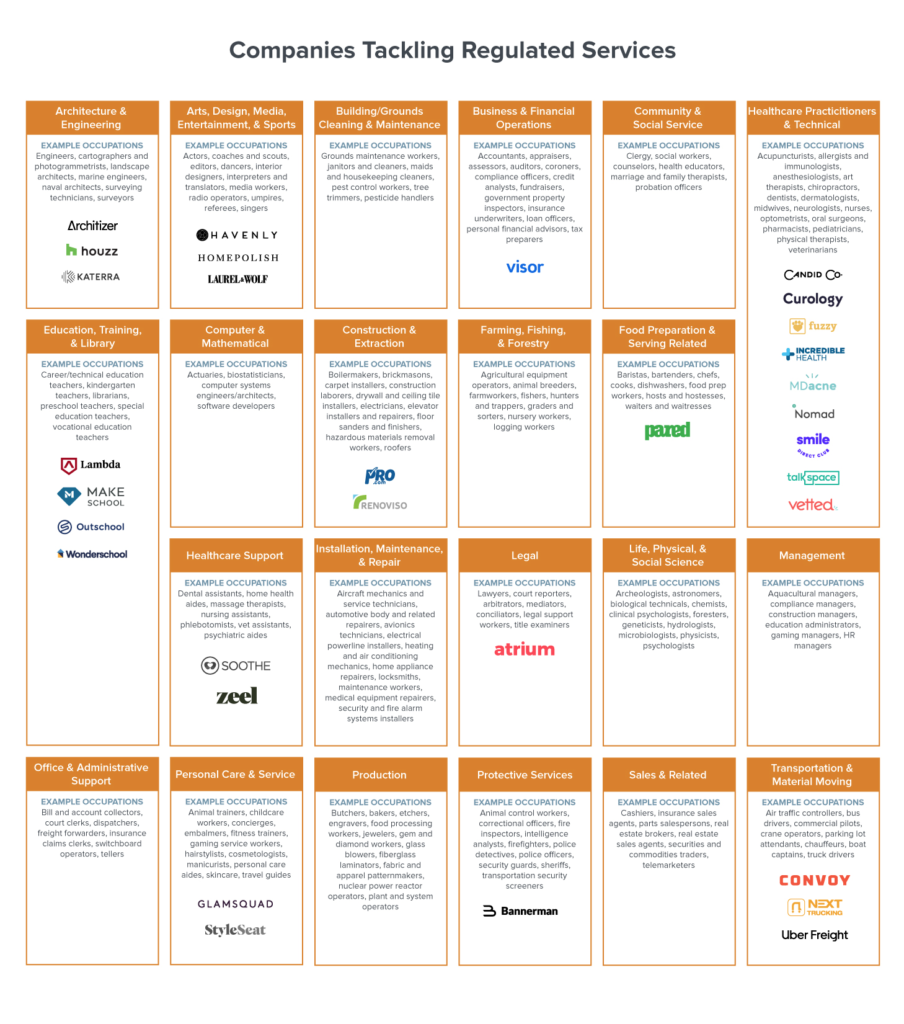
Regulation of services was critical pre-internet, since it served to signify a certain level of skill or knowledge required to perform a job. But digital platforms mitigate the need for licensing by exposing relevant information about providers and by establishing trust through reviews, managed models, guarantees, platform requirements, and other mechanisms. For instance, most of us were taught since childhood never to get into cars with strangers; with Lyft and Uber, consumers are comfortable doing exactly that, millions of times per day, as a direct result of the trust those platforms have built.
Licensing of service professions create an important standard, but also severely constrains supply. The time and money associated with getting licensed or certified can lock out otherwise qualified suppliers (for instance, some states require a license to braid hair or to be a florist), and often translates into higher fees, long waitlists, and difficulty accessing the service. The criteria involved in getting licensed also do not always map to what consumers actually value, and can hinder the discovery and access of otherwise suitable supply.
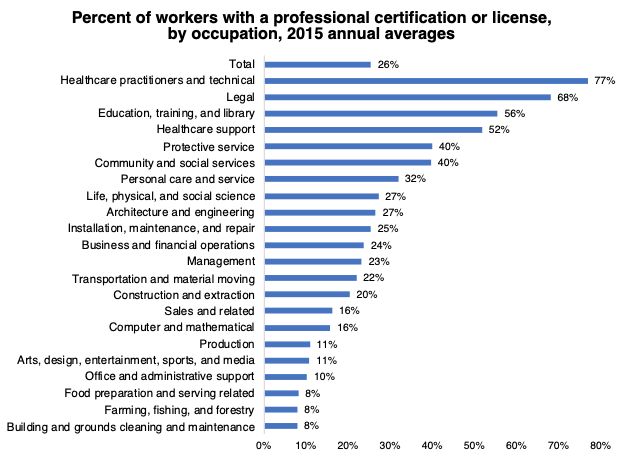
Above: Bureau of Labor Statistics. (11/9/18)
Five strategies to unlock regulated industries
We’re starting to see a number of startups tackling regulated services industries. As with each wave of previous service marketplaces, these new approaches bring more value-add to unlock the market, with variations in models that are well-suited to different categories.
The major approaches in unlocking supply in these regulated industries include:
- Making discovery of licensed providers easier
- Hiring and managing existing providers to maintain quality
- Expanding or augmenting the licensed supply pool
- Utilizing unlicensed supply
- Automation and AI
1) Making discovery of licensed providers easier
Some startups are tackling verticals that lack good discovery of licensed providers. Examples include Houzz, which enables users to search for and contact licensed home improvement professionals, and StyleSeat, which helps users find and book beauty appointments with licensed cosmetologists.
2) Hiring and managing existing providers to maintain quality
Companies can raise the quality of service by hiring and managing providers themselves, and by managing the end-to-end customer experience. Examples are Honor and Trusted, managed marketplaces for elder care and childcare, respectively, which employ caregivers as W-2 employees and provide them with training and tools. In the real estate world, Redfin agents are employees whose compensation is tied to customer satisfaction, unlike most real estate agents who are independent contractors working on commission.
3) Expanding or augmenting the licensed supply pool
Expanding the licensed supply pool can take the form of leveraging geographic arbitrage to access supply that’s not located near demand. Decorist, Havenly, Laurel & Wolf, and other online interior design companies enable interior designers around the world to provide design services to consumers without physically visiting their homes (yes, in many parts of the US interior design requires a license!). With improvements in real-time video, richer telepresence technologies, and better visualization technologies, more synchronous services are also shifting from being delivered in-person to online. Outschool and Lambda School are examples of de-localizing instruction, enabling teachers and students to participate remotely while preserving real-time interaction.
Another approach is to help suppliers navigate the certification process. A16z portfolio company Wonderschool makes it easier for individuals to get licensed and operate in-home daycares.
Lastly, there’s the approach of augmenting certified providers so they can serve more customers. Fuzzy, an in-home veterinary service, uses AI and vet technicians to augment the productivity of licensed veterinarians; and a16z portfolio company Atrium builds automation and workflow management to provide efficiency gains in the legal industry.
4) Utilizing unlicensed supply
Some companies utilize unlicensed supply–notably Lyft, Uber, and other peer-to-peer rideshare networks. Another example is Basis, a managed marketplace for guided conversations with trained but unlicensed specialists to help people with anxiety, depression and other mild to moderate mental health issues.
In the pet space, Good Dog is a marketplace that brings together responsible pet breeders and consumers looking for a dog. Going beyond existing breeder licensing, which the company felt didn’t map to what consumers valued, Good Dog established its own higher set of standards and screening process in conjunction with veterinary and academic experts.
5) Automation and AI
Other startups automate away the need for a licensed service provider altogether. These include MDAcne, which uses computer vision to diagnose and treat acne; and Ike Robotics and other autonomous trucking startups which remove the need for a licensed truck driver.
Opportunities for companies addressing regulated services
The last twenty years saw the explosion of a number of services coming online, from transportation to food delivery to home services, as well as an evolution of marketplace models from listings to full-stack, managed marketplaces. The next twenty years will be about the harder opportunities that software hasn’t yet infiltrated–those filled with technological, operational, and regulatory hurdles–where there is room to have massive impact on the quality and convenience of consumers’ everyday lives.
The services sector represents two-thirds of US consumer spending and employs 80% of the workforce. The companies that reinvent various service categories can improve both consumers’ and professionals’ lives–by creating more jobs and income, providing more flexible work arrangements, and improving consumer access and lowering cost.
The companies mentioned in this essay just scratch the surface of regulated industries. You can imagine a marketplace for every service that is regulated, with unique features and attributes designed to optimize for the customer and provider needs for that industry. (A full list of regulated professions in the US can be found here.) We fully expect more Airbnb- and rideshare-sized outcomes in the service economy.
If you’re a founder who is looking to take on the challenge of tackling more complex services and bringing them online, we’d love to hear from you.
Thank you for reading!
How to build a growth team – lessons from Uber, Hubspot, and others (50 slides)
Dear readers,
Building a new growth team is hard. You have to figure out the macro organizational issues – how it fits in with marketing, product, and other functions – as well as the micro, like how to measure the success of these teams. It’s a tricky topic and something that a lot of teams are thinking about right now.
A few months ago, I spoke on lessons learned from various organizational structures for the growth teams at Uber, organized as 5 broad topics:
- Why create a growth team?
- What’s the difference between a “growth hacker” and a growth team?
- What’s the difference between growth and marketing/product/whatever?
- Where should growth teams focus?
- I’m starting or joining a growth team! What should I expect?
To answer these questions, Brian Balfour and I worked on a deck, based on materials from Reforge. (Check them out for more practical reference materials on this topic)
The deck is presented below! Hope you enjoy the materials, and feel free to reach out or follow me for realtime updates at @andrewchen on Twitter.
Thanks,
Andrew
The Deck
Above: Today, I’m going to present a few key topics that you need to figure out as you build a growth team for your company. First, why you might want to create one in the first place. Then, the differences in skillsets for both individual practitioners versus the org – and versus existing functions like Product and Marketing. And finally, where teams should focus and how to make an impact in the early days.
The ideas within these topics are drawn from several places – interviews and discussion with the folks who lead growth teams at places like Slack, Dropbox, Hubspot, Pinterest, and others, but also my own personal experiences at Uber.

Above: Many of you may remember when Uber looked like this. It was all up and to the right.
The growth team was originally created in 2013, founded by Ed Baker. It experimented with a ton of different organizational configurations – I joined a few years after it was created and spent about 3 years there, and spent most of my time on driving growth on the rider side of the platform.
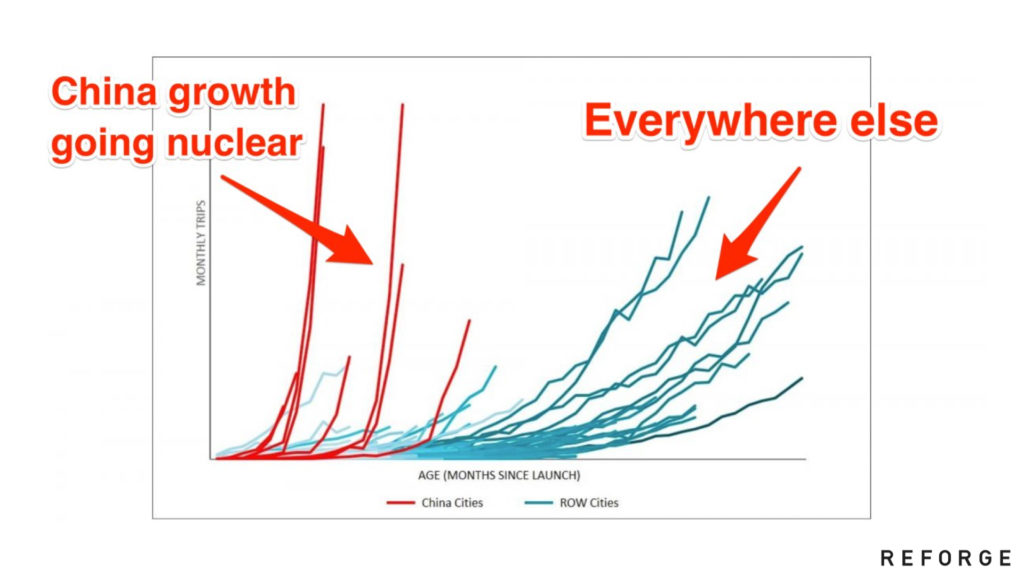
Above: While I was at Uber, a lot of amazing projects were run out of the growth team. My colleagues in China Growth made incredible progress – shoutout to Ben Chiang, Han Qin, Michelle Chen, Jia Zou, Vinay Ramani, and many others – in addition to much of the progress being made across the US and the rest of the world.
At its peak , the growth team included China Growth and had over 500+ people. It was an amazing, dynamic time for the company. I learned a ton and am excited to share some of the ideas today.

Uber has changed a lot over the years. We certainly changed logos many times. But I think there are some really critical things that we can pass along to others in the ecosystem.
Let’s start with the basics…
Above: First, why create a growth team in the first place? We know that a lot of companies have folks with formal growth teams, and informal ones with growth PMs/marketers/etc running around.
Above: When you just look at the cross-section of companies in the industry, many of the newest and best B2B and consumer companies have all built growth teams.
We’ve also heard many Boards ask their CEOs to invest in growth teams. Why did this even emerge in the first place?
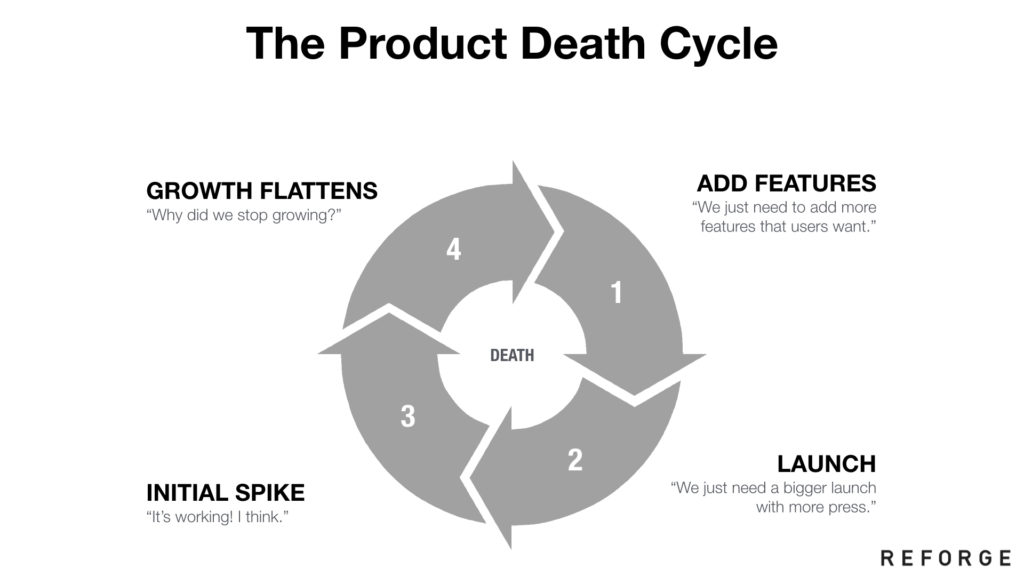
Above: The easiest way to talk about The Product Death Cycle.
Unfortunately, this is how products are often shipped and released. You have someone with a vision, who builds some features and does a launch. They might get an initial spike of traction, but when growth flattens, it’s not clear where to take things. They talk to some customers, ask what they want, and try again. They add a few more features, re-launch, and so the cycle goes on.
Do that too many times, and all of a sudden, you’re dead.
Why?
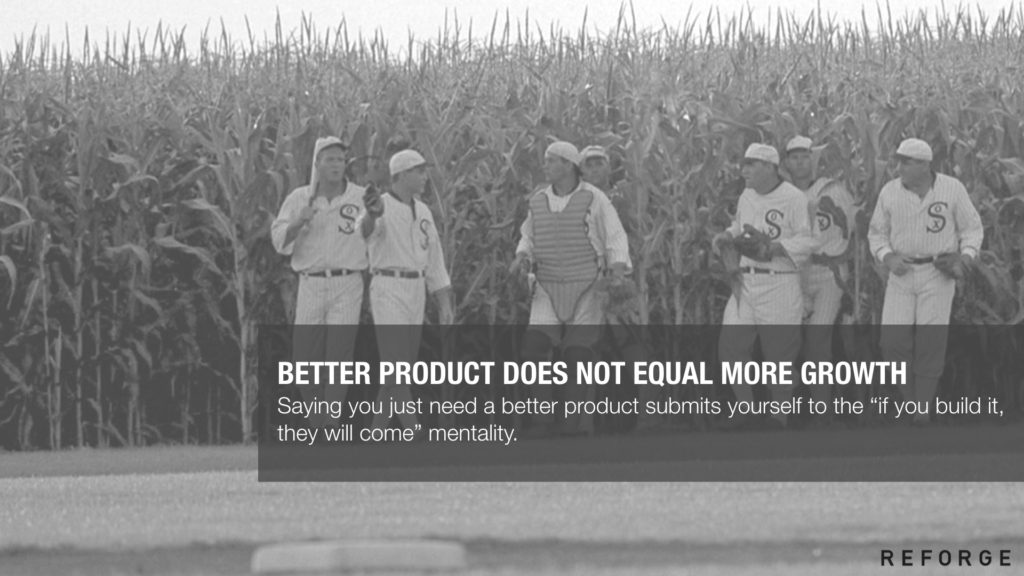
Above: If you build it, they may not come, it turns out. Better products, and more features, do not necessarily equal growth.
Many of the key levers for driving more user acquisition, retention, engagement, can sometimes sit outside the toolkit for most great product leaders. There’s a long laundry list of skills that are critical, but not often considered core to the product: adtech integrations, signup funnel A/B testing, optimizing notification delivery, testing price points, testing cohort curves, etc. Yes, occasionally there are people who know all of it – but they are rare!
Furthermore, no one individual can drive this. Instead, you need to bake this into your organizational goals and DNA. You need to collect these efforts within the larger framework of the company.
Above: Thus, we seek to build a framework for growth that’s a discipline and organizational structure within its own right.
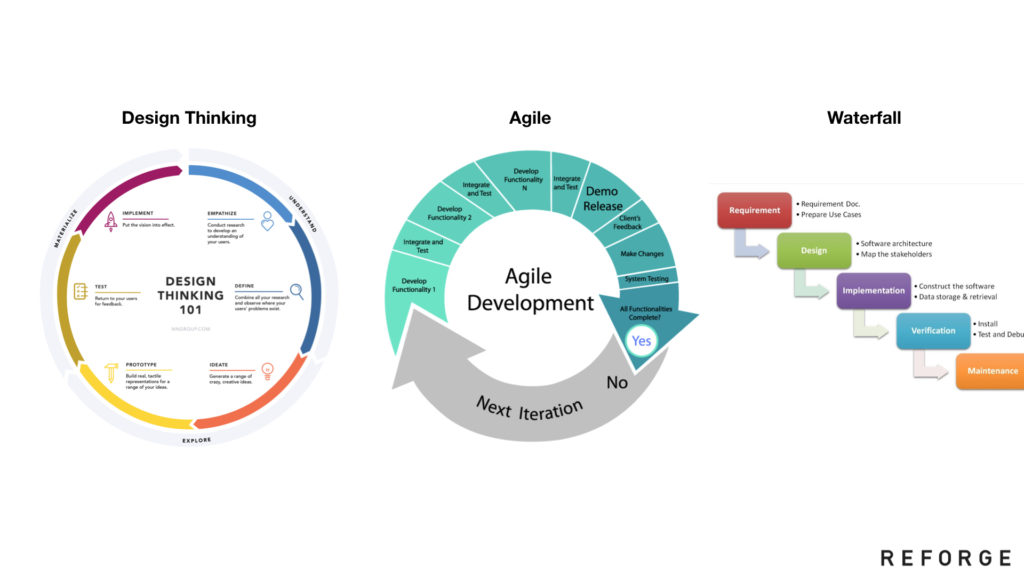
We’ve come to see that “design thinking” and “agile engineering” are their own systems of organizational structures, workflows, philosophies, and skillsets. They are key to how we work within a company.
In the same way, we can build growth teams as a system too.
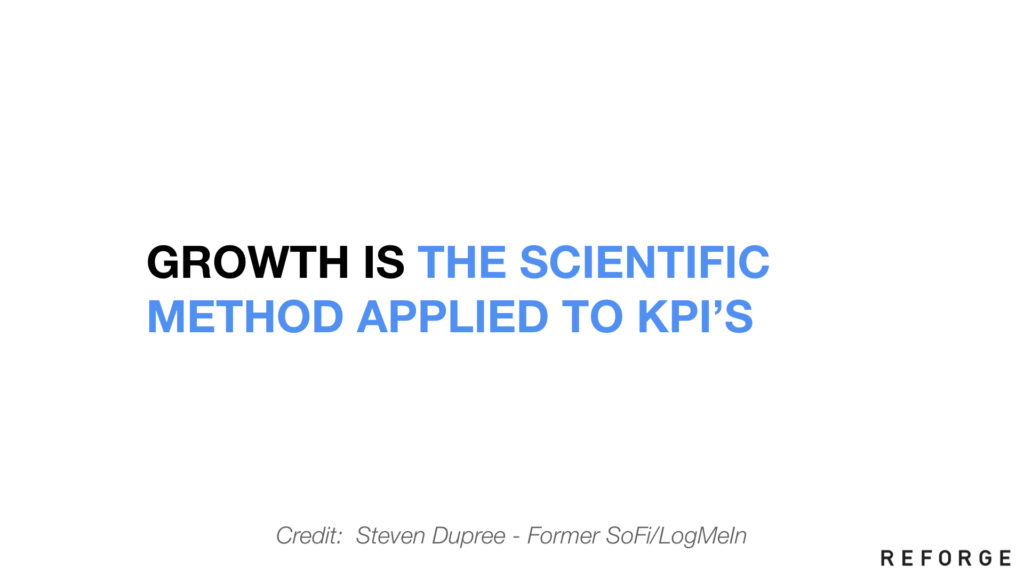
Above: Product Growth is the discipline of applying the scientific method to business KPIs.
It provides an underlying system for increasing metrics whether it’s revenue, acquisition, retention, engagement, or another key business metric.
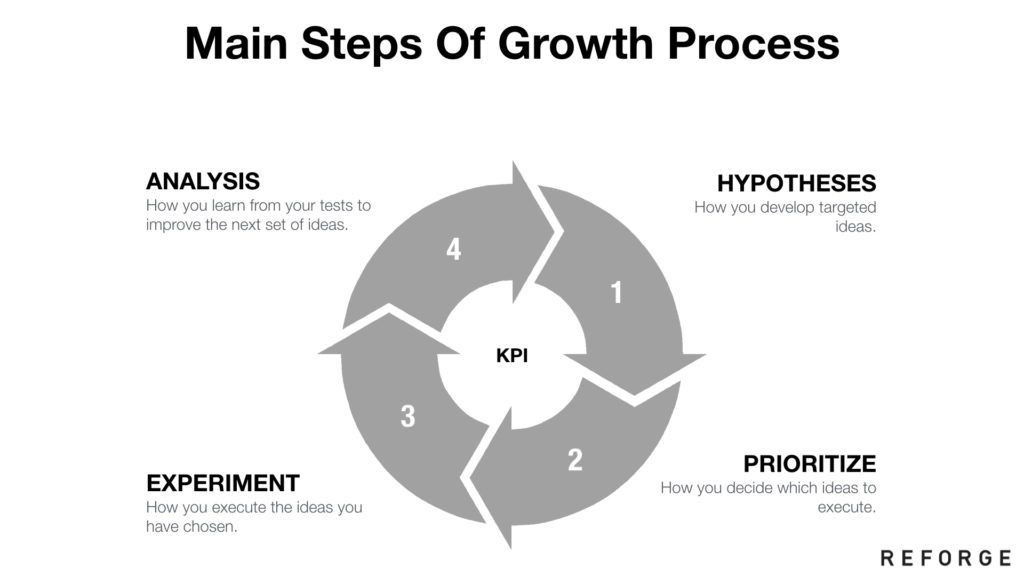
Above: And just as you’d expect with the scientific method, the steps are build on understanding the data, creating hypotheses that identify why certain processes are happening, prioritizing those ideas, running the experiments, and then repeating the cycle.
That way, if you think your active user count is low, you can analyze the data to understand that you need more top of funnel user acquisition, then hypothesize that a combo of paid advertising and referrals can help, and then execute against that.
That is much, much better and more targeted than just building more features that your users ask for, and expecting growth to magically increase as a result. (Maybe you should build those features anyway, but don’t do it for growth!)
Above: Second topic. Let’s talk about the difference between the “Growth Hacker” – a term that Sean Ellis invented and I helped popularize – and a “Growth Team.” This is an important one.

Above: In the early stages of the growth skillset, there were no teams. There were a number of individuals and startup founders who were putting the necessary ideas, workflows, and tactics together. Some of these folks would refer to themselves as “growth hackers” in a tongue-in-cheek way.
As the skillset grew, it was clear that to do anything impactful, especially within the context of a larger/complex product, you needed to organize entire groups of people.
Above: Thus the growth team emerged, with the philosophy that you don’t want a lone genius with all the levers, and a team of helpers. Instead, you need to create an organization with a broad set of skills.
Growth is a team sport, and to run the scientific method on your KPIs, you need a lot of people who can help you.
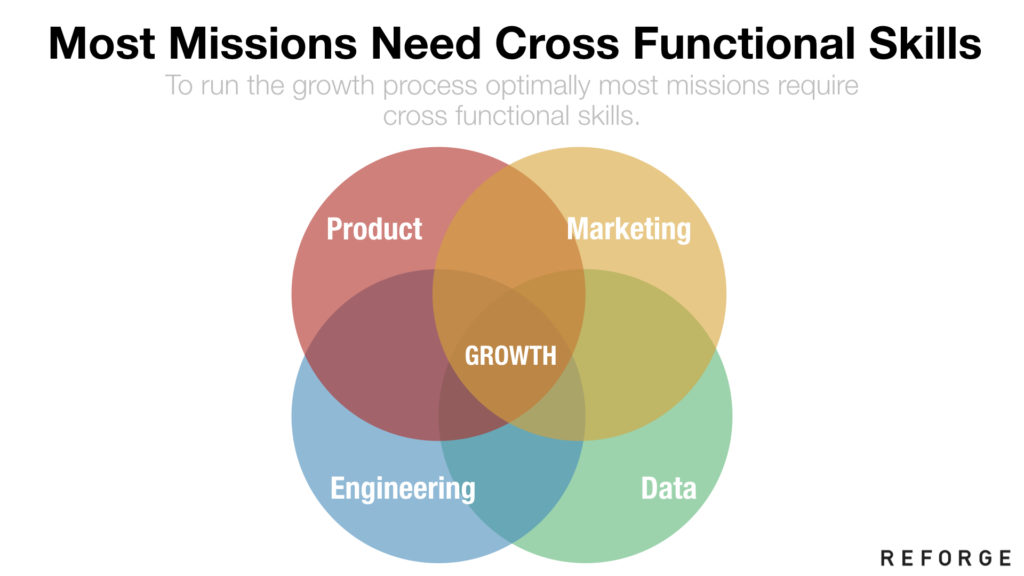
Above: For most of the missions for a growth team, you need many different functional roles to help – from Product, Marketing, Engineering, Data, Ops, Finance, etc., etc. You combine all of these folks into individual teams and organize them together into a growth org.
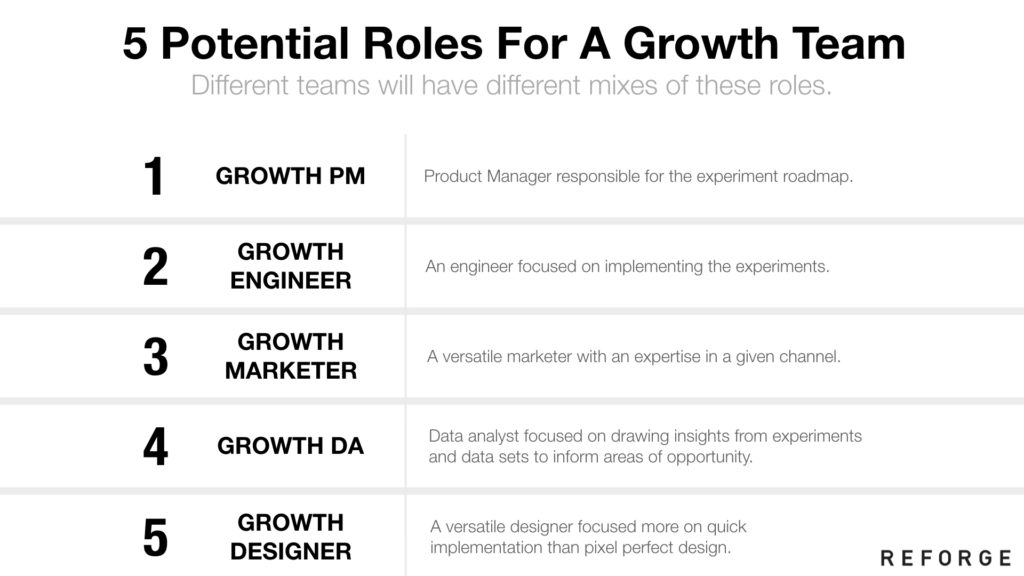
Above: What are people doing within all of these roles?
- Growth PM: A product manager that’s responsible for the experiment roadmap
- Growth engineer: An engineer who’s focused on technical decisions and implementing experiments
- Growth marketer: A versatile marketer with an expertise in a given channel – from paid marketing to SEO to email to others
- Growth data: An analyst focused on creating insights – both macro on the user lifecycle, and micro, on specific experiments
- Growth design: A designer leading the UX, but with an emphasis on speed
You might also loop in other function – for example at Uber, a lot of decisions around incentive spend had to include folks from Finance or Pricing. And you’d always have to include Ops to think through how it affected things on the ground.
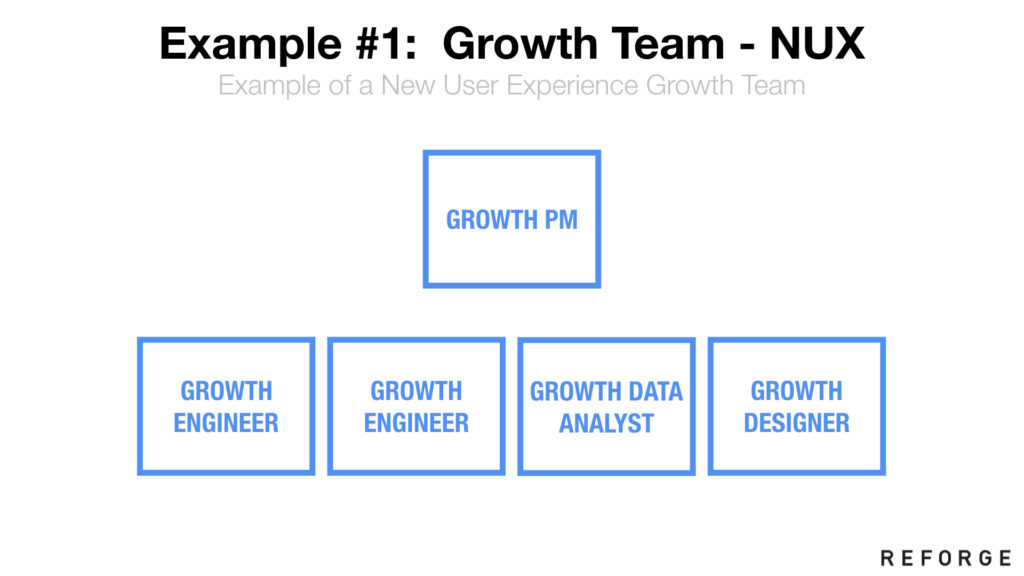
Above: Depending on the problem you’re trying to solve, you might have a different makeup on the team. For the new user experience – which might include increasing signup conversion, and maybe even integration into ads – you’d probably emphasize engineers. You’d want an Android and iOS engineers. Plus even performance marketing folks, some data analysts to look at the metrics, etc.
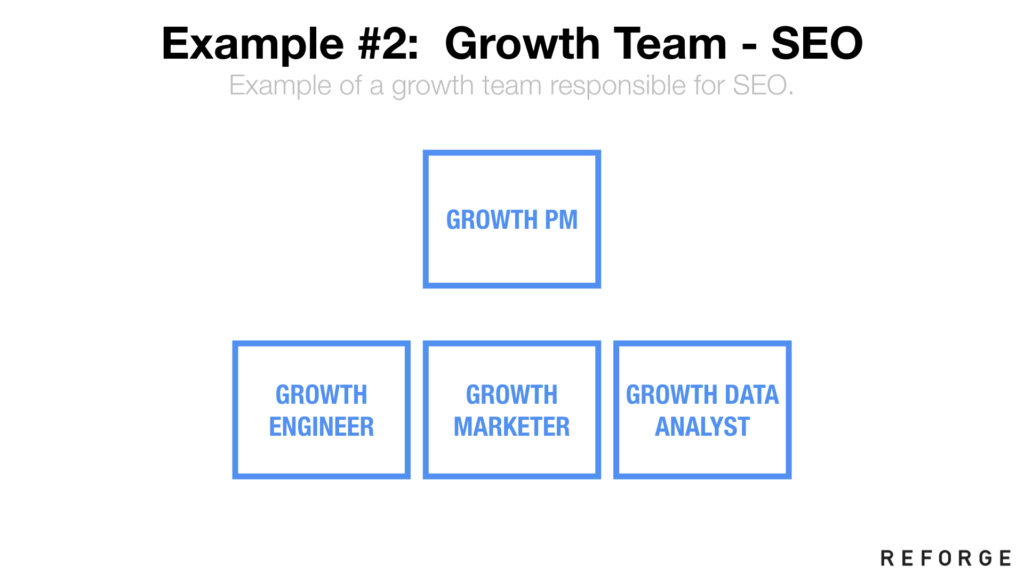
Above: If you were working on SEO, on the other hand, then maybe you wouldn’t need designers. This might be more about optimizing page structure, where the content goes, etc. In this case, you might emphasize SEO marketing, data, and a full-stack engineer for web.
Ultimately, the goal is to define the problem based on your insights and hypotheses, and staff the team to solve that particular problem. The individual teams might emphasize different skills, and the macro organizational structure of where the growth team fits has the some complexities depending on the missions of other teams.
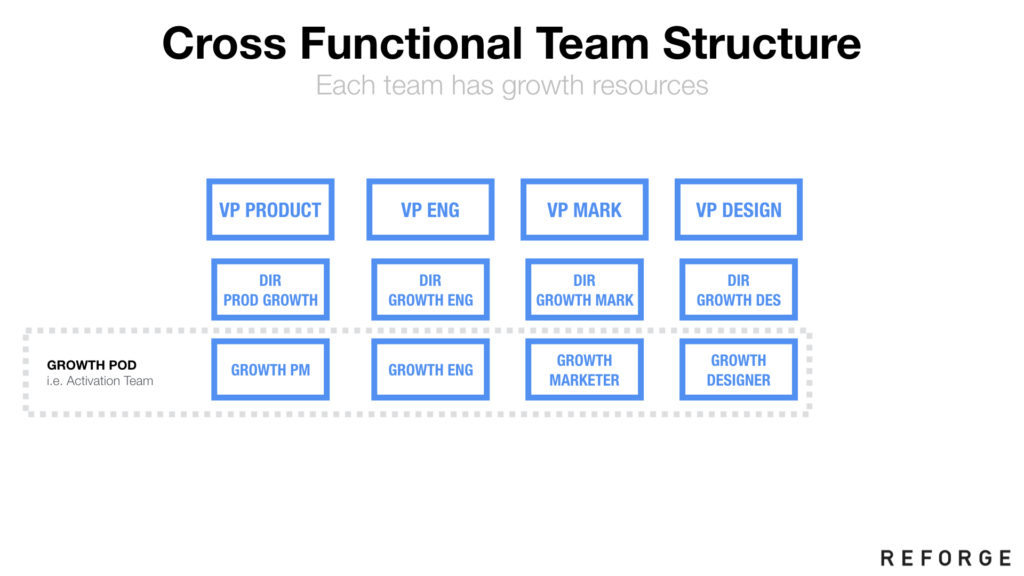
Above: One common structure is to treat the Growth Team as a set of pods, each one matrixed to their respective functions. So you might have a Growth PM that reports into Product, plus the others, and all together they are the growth team. Many product teams look like this, and this is set up to match.
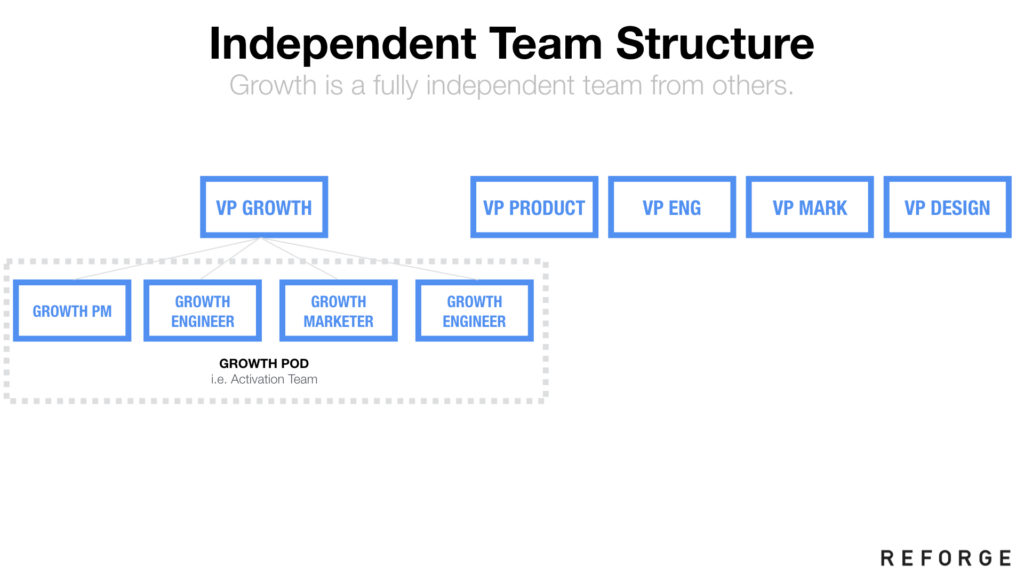
Alternatively, at Facebook and in an early incarnation of the Uber growth team, you have things set up more like a business unit. You have functions reporting into a GM, and the pods underneath. This has the advantages of creating a lot of independence within the team, with the complication that you split the various orgs – this can cause complexity and sometimes conflict as well.
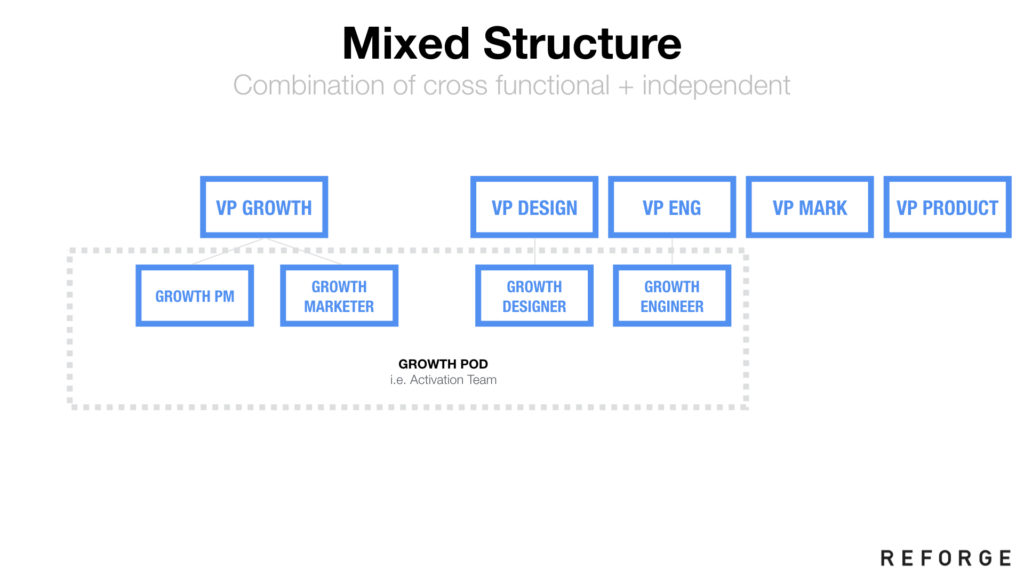
Above: You can obviously pick and choose and have hybrid models as well.
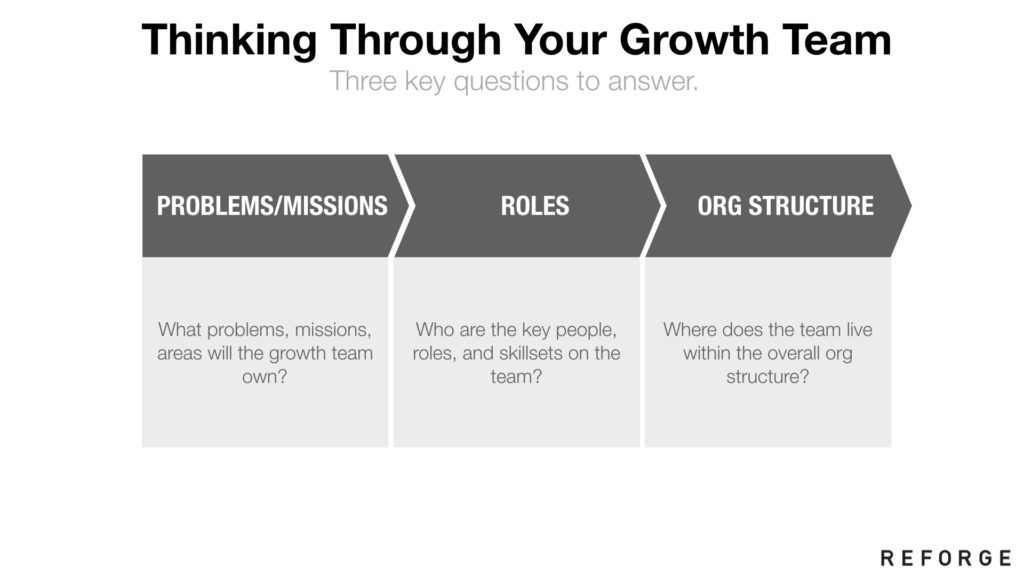
Above: Too many startups are beginning with “I need a growth team!” and accepting a random org configuration, without thinking it through from the fundamentals. Ultimately, You have to start with the problems you are trying to solve. Begin with the KPIs, the insights you’ve generated, and then move onto execution. You staff the problem area and the type of execution you want. The organizational structure follows from there.
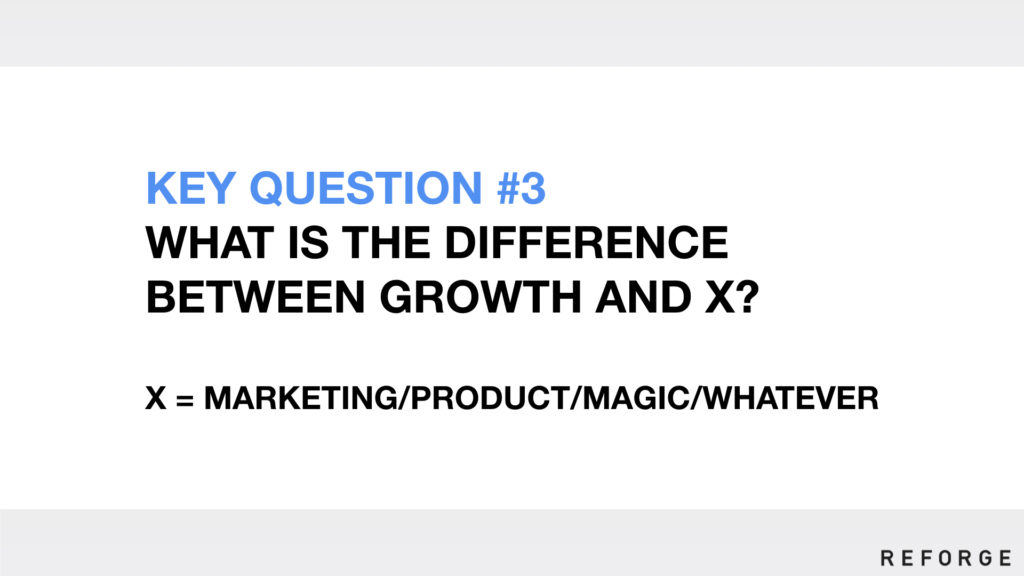
Above: This is a question I often get. Isn’t growth and marketing just the same thing? Isn’t growth and product just the same thing? Can’t everyone just be responsible for growth?
In this section, I’ll walk through some of the practical differences.
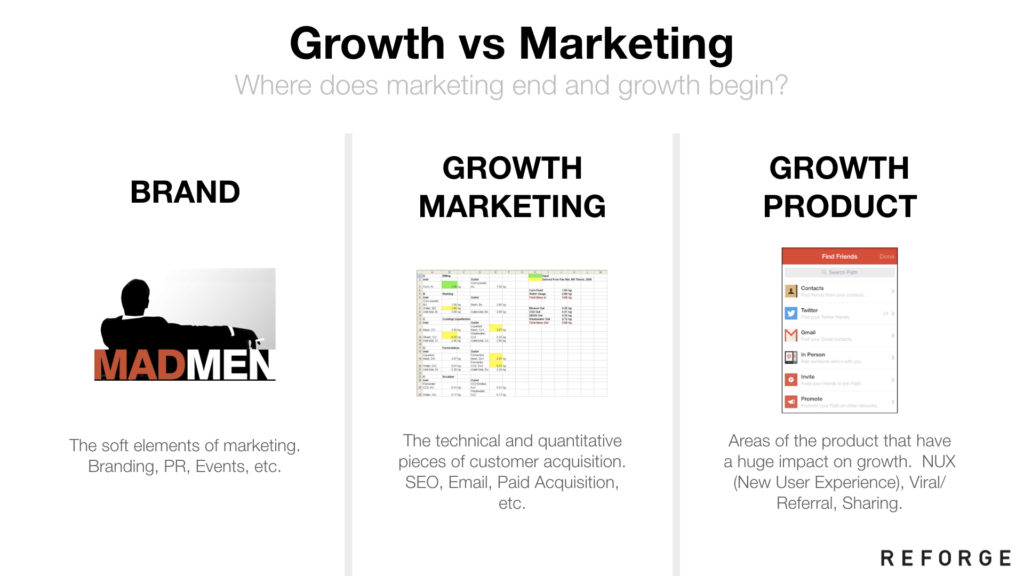
First, when it comes to Marketing and Growth, there are a lot of specialties that you want to solve:
- Brand marketing
- PR
- Events
- Content marketing
- SEO
- Paid marketing
- Viral/referral features
- New user experience
- User-to-user notifications
- etc
You could house all of these in a bunch of different configurations, but roughly speaking, you often have three categories of functions:
- Brand
- Growth marketing
- Growth product
It’s usually obvious that Brand ends up in Marketing. And similarly, things like NUX and product-generated notifications end up in a Growth team. But some of the middle levers, like SEO/Paid marketing/Email/etc, could potentially sit in either. I’ve seen both. Facebook has much of performance marketing sitting inside the Growth team. Uber started that way, but ended up having it all go into Marketing. There’s a lot of different possible configurations.
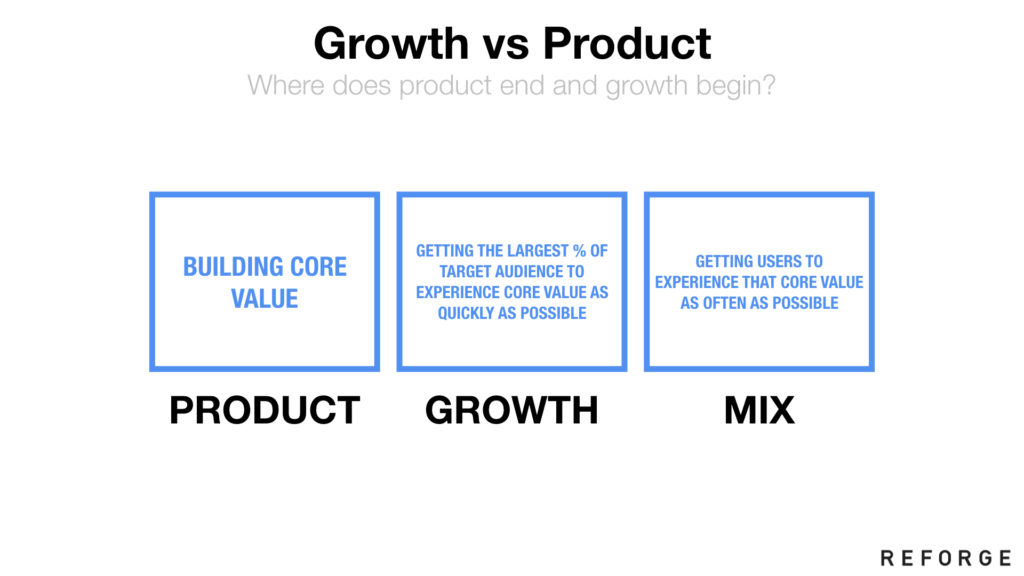
Above: If core product teams have engineers, designers, and PMs, and so do growth teams, what’s the difference? It’s all dependent on what they do. Product teams focus on creating core value. Enhancing product/market fit over time. This means obsessing over every little interaction in the core engagement loop – it’s a game of inches, and those inches count.
On the other hand, growth teams should focus on getting the core value out there to the world – getting as many folks as possible to experience that value.
There’s a middle ground on making users experience core value as frequently as possible – you could imagine putting that in either team, but if the solutions tend to be very iteratively/quantitatively-driven, then maybe put it in the Growth team.
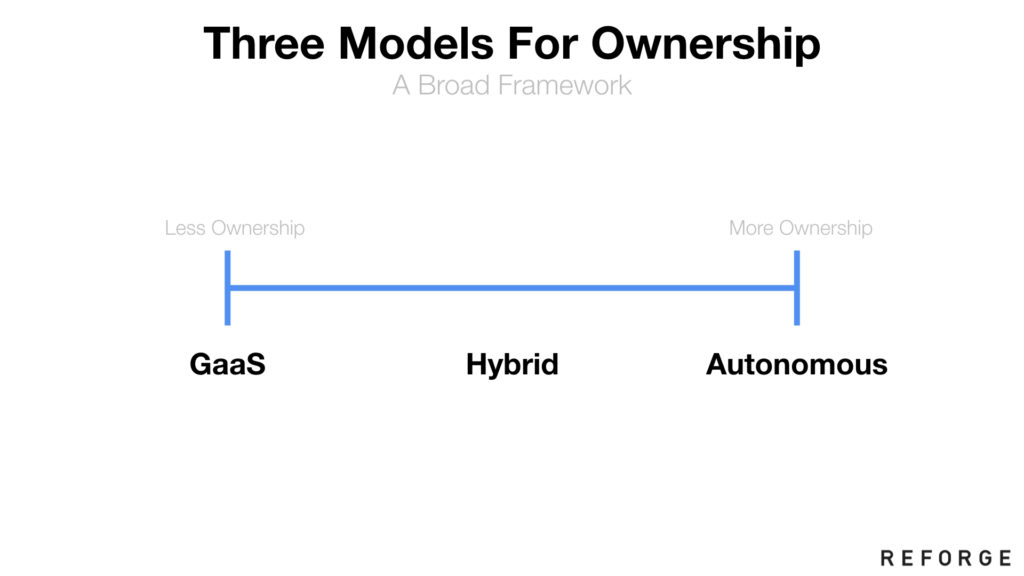
Above: You also have to decide the ownership model. There are two extremes: Growth-as-a-Service and Autonomous. And everything in between.
In “Growth as a Service” – the team doesn’t technically own any feature or codebase. They jump into the highest value part of the product, do their analysis and optimizations, ship a bunch of improvements, and move on. It’s important for the team to be gentle, as they are the guests, but it’s also important that they stay lightweight. If the growth team ends up owning every piece of code they touch, then they would eventually get stuck in maintenance mode for everything.
On the other hand, a full ownership model means that the growth team could own the new user funnel, notifications, ad tech, the A/B testing platform, payment flows, and many other critical areas where numbers trump intuition. This can work, but then the team needs to be staffed properly.
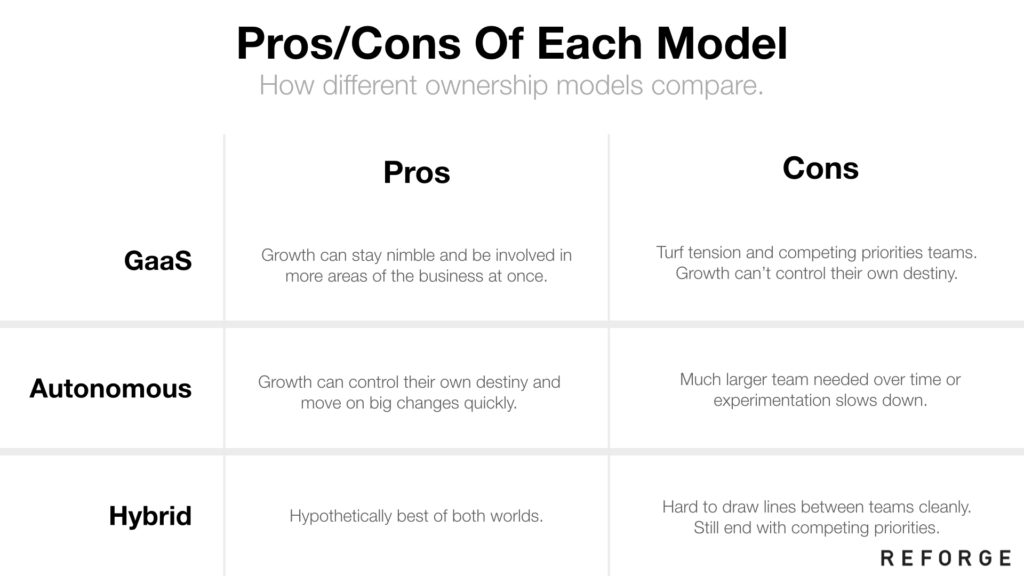
Above: There are ultimately lots of pros and cons to each model. Uber went through the entire spectrum, but over time, came to own more and more pieces of the product. But you’ll have to decide based on your own constraints, org, and product requirements.
Once the growth team’s been set up, where should they focus? As discussed previously, their mission and toolkit ought to be distinct from those used by the marketing or product team. Especially in the early days of the team, there should be low-hanging fruit that can be picked off easily.
Although it’s easy to jump right into user acquisition, or looking at churn, let’s zoom out and look at the system. Let’s start with a prioritization framework.
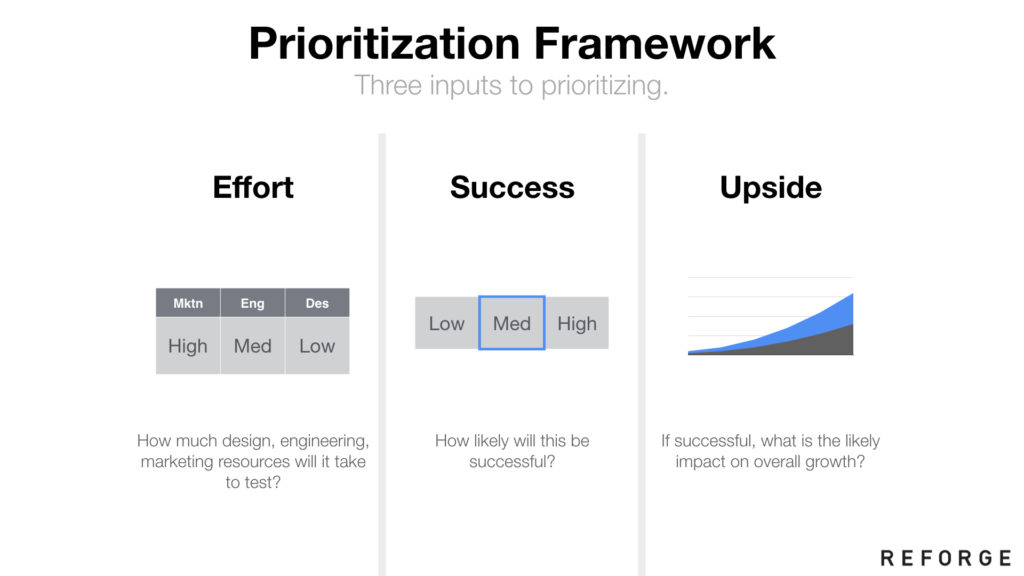
Above: Ultimately there are three key things you’re trying to trade off – and one is particularly tricky:
- Effort. How much design/eng/marketing resources does it take to execute?
- Success. How likely will it be to be successful?
- Upside. This is the tricky one – but if it works, how much will it affect overall growth?
Every growth experiment is ultimately a prioritization based on the ranking of these three axes, and over time, your growth team will be smarter about how to pick. But I wanted to provide some notes on where a growth team is likely to go wrong in their prioritization.
The most common anti-pattern on picking growth projects is where a +50% increase on a feature touching 0.01% of users is celebrated, but a +5% increase that touches 50% of your active users feels smaller. Of course when you do the math, the latter is much more important as you ultimately want these bottoms up experiments to hit your top-down KPIs.
Another common anti-pattern is to focus on large effort, large upside projects over low effort, low/medium upside projects. Almost everyone overestimates their chances of success, so it’s better to go for more execution throughout over big bets… until you run out of easy ideas or you have enough resourcing to build a portfolio of small and big projects.
Some notes on each factor:
- In general, Effort is the easiest to understand. If you define a project, your team will be able to execute against it like anything else. The usual advice I give here is to bias towards low effort projects early on in a growth team
- Success rate can be controversial, because the things that work in growth are not necessarily things that users will self-report – and thus, people on teams will usually say, “I would never want this. I would never do this.” And yes, you implement the best practices and things work. The classic example here is the desire to add comprehensive content on landing pages, with links to a million other places. It’s a well understood design pattern to provide just as much information as is needed to get the signup – nothing more.
- Upside, of the three, is the trickiest thing to understand though. It’s also the lever with the most power, as it provides strong guidance on where in the product the growth team should be focusing.
Let’s do a deep dive on Upside.
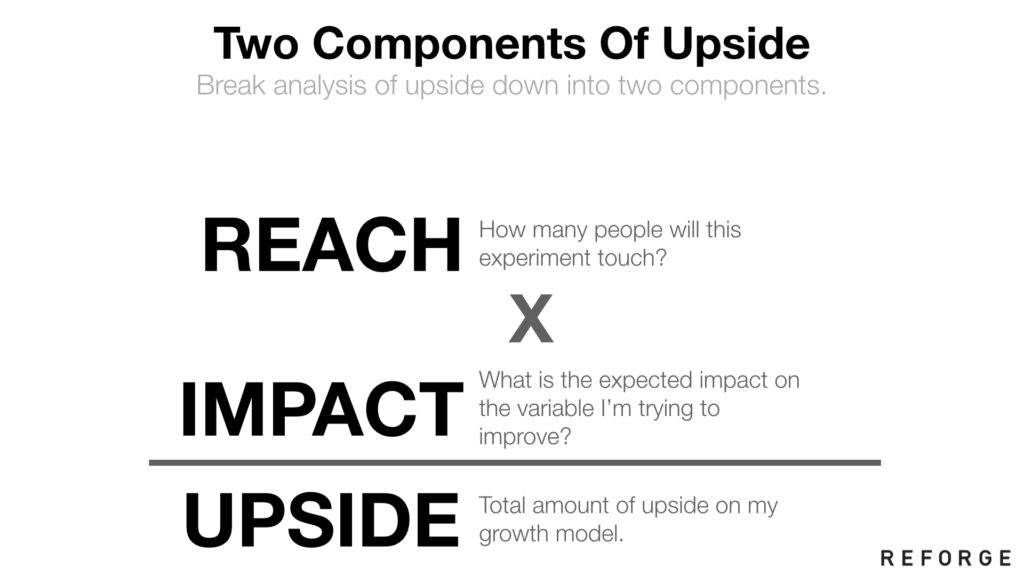
Above: Upside is ultimately measured in absolute terms – how many additional subscribers did you gain, the number of signups generated, etc. You calculate it using two components – Reach and Impact. Reach is the measurement of how many end users are touched by the change of a feature. Impact is how much the metric moves as a result of the change.
Between these two factors, Impact tends to be the most random. Sometimes a change you’ll make moves things by +5% and sometimes it can move things +50%. In the main, you’ll get something in between for the vast majority of your projects. For some projects, impact can be huge if it’s a product experience that can happen multiple times – for example, a new highly-relevant notification that’s sent in the core engagement loop of a product. Or something that significantly amplifies a viral loop, causing the flywheel to spin faster and faster. (But that’s out of the norm- but also tells you that you might want to focus on these outsized impact cases)
Reach, on the other hand, is an amazing lever that is often misunderstood. This is often the sweet spot for understanding the best kinds of projects.
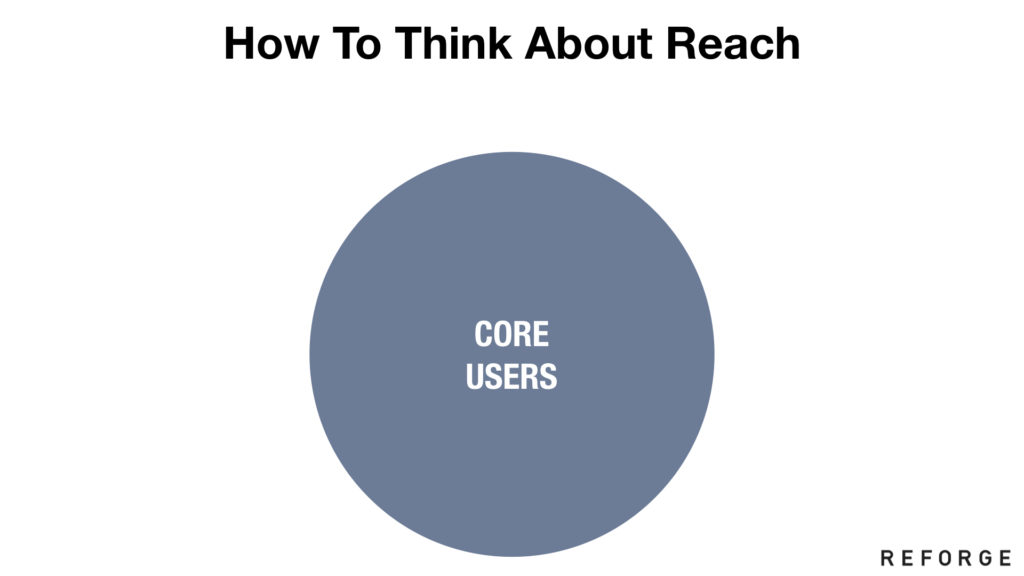
Above: In the main, most product teams focus on making their core product experience better, which benefits their core users. This has a lot of benefits – after all, they are the most engaged, the most valuable from a monetization perspective, and in a multi-sided platform, they produce the photos/content/sales/etc that sustain the rest of the ecosystem.
On the other hand, core users are often only a small % of your total active users.
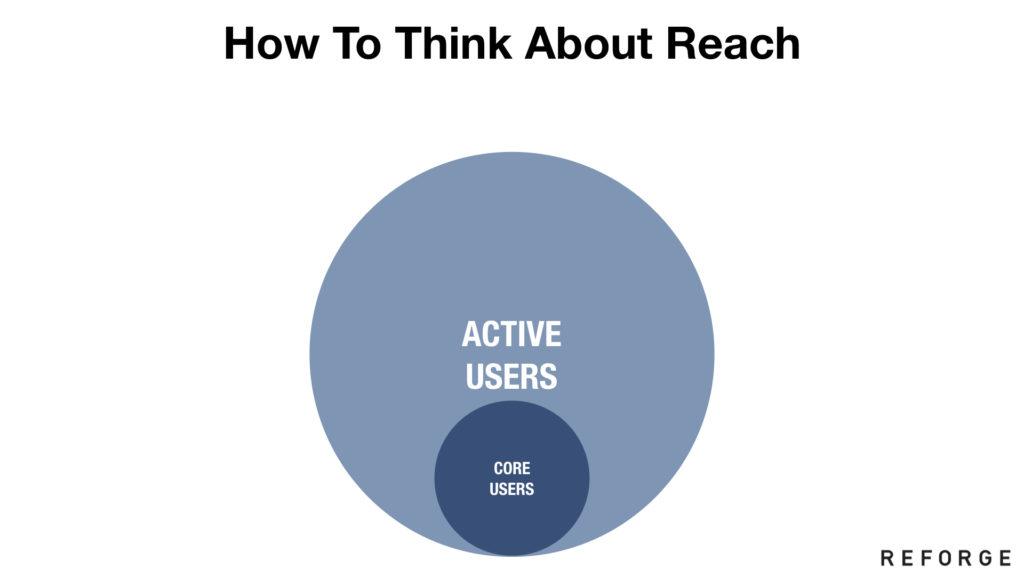
Above: Depending on how you define core users, they are usually only 5-25% of your active user base. If you are looking at the segment of your userbase that actually produces content, rather than just consuming it, you’ll see it’s usually a small %. Or the ratio of your hardcore users who are generating a ton of content, versus purely passive consumers. It’s always a small amount.
As a result, if you have projects that can target your active users, but not your core ones, then you might have 4-20X more reach! Wow.
But that’s not all, there are more concentric circles.
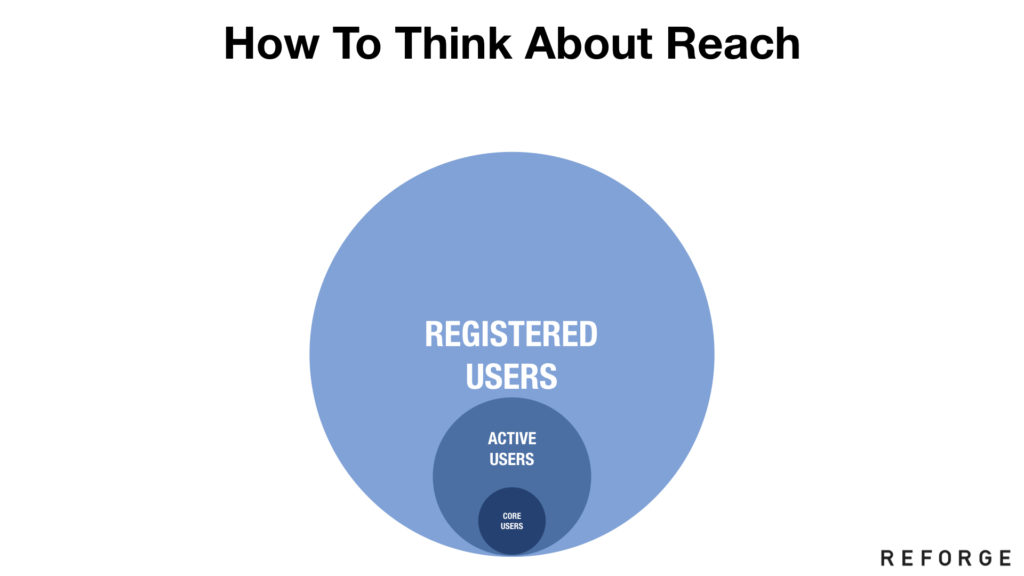
Above: On average, only 10-50% of your registered users might be active in any given month. 50% is world-class good – like Facebook and their ilk. Usually most products are closer to 10-20% because the vast majority of products have a ton of one-hit wonders: People who try the product once, but then forget to ever come back.
Projects at this level ought to focus on activation. If you can understand what gets a user to become active, then you can introduce that during the onboarding flow, thus converting them to active or core users.
The other set of activities here – for products with large, established audiences – is the flow from being inactive/churned to coming back into the product. Are they getting relevant emails to get reactivated? If they’ve forgotten their password, are you optimizing that flow as critically as if it were a signup flow?
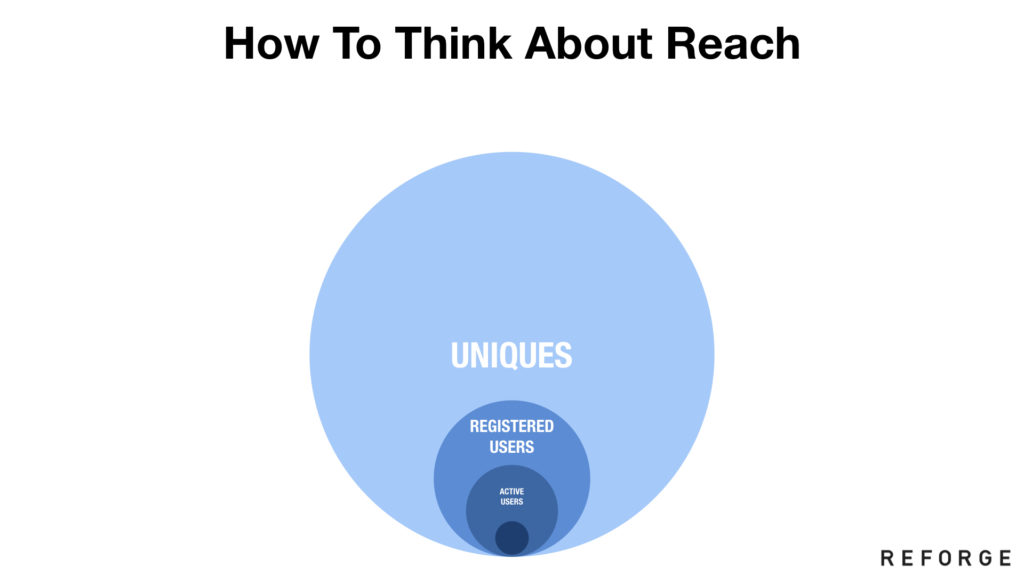
Above: Of course, for many products – and this is more of a web thing – there are people who look at a product but never sign up. Most landing pages might only have 10-50% conversion rate to signup! Furthermore, a lot of products have “side doors” – like Dropbox shared file links, or YouTube video pages – that get the majority of the traffic. Those become critical places to optimize.
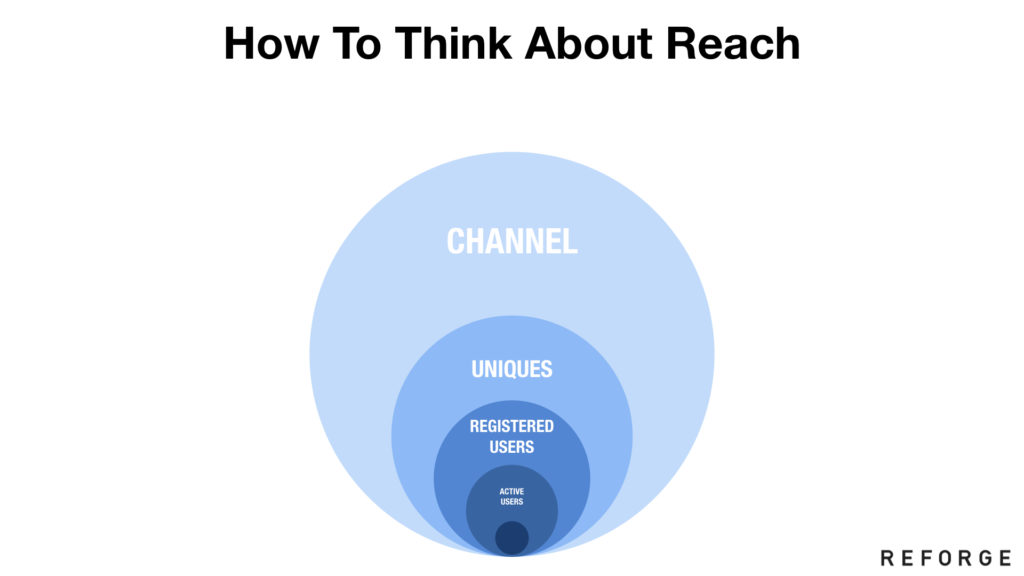
Above: Of course, even bigger than all the people who have interacted with your product at all – even in a logged out state – there’s everyone in your primary acquisition channel (whether that’s on Facebook or Google or something else) that have never heard of you before. This is true top of funnel acquisition.
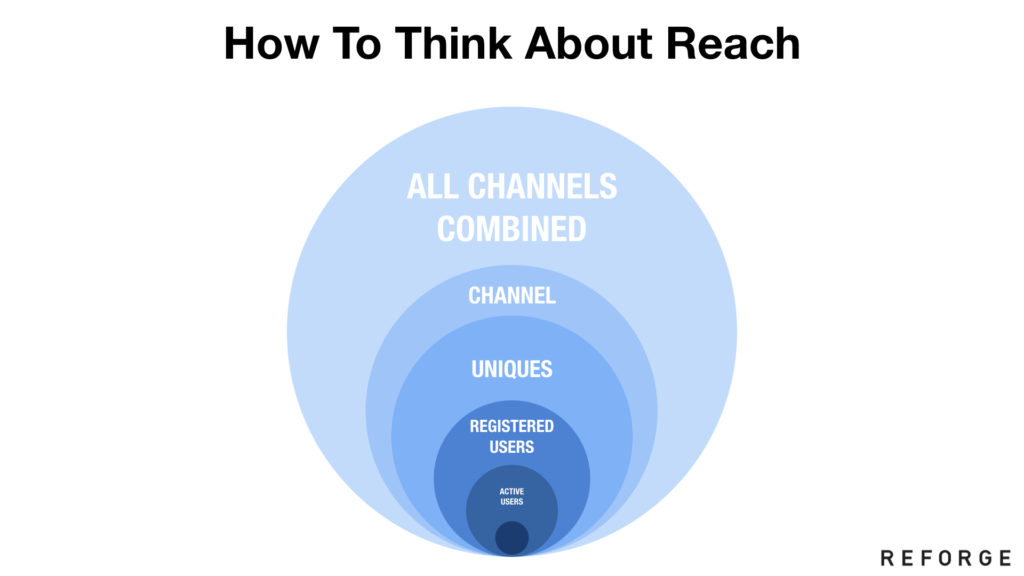
And of course, there are all the channels you haven’t even experimented with. That’s why adding a new channel – like trying a referral system when it doesn’t yet exist – can be such a big needle mover.
Above: All of this is to say that if you are looking for the biggest lever on growth upside, it’s probably in addressing Reach. And think of the concentric circles when you are finding that your growth team’s projects collide with the core product team – move to further and further concentric circles, whether that’s targeting new users, churned users, and everyone out on the edge who hasn’t yet bought into your product.
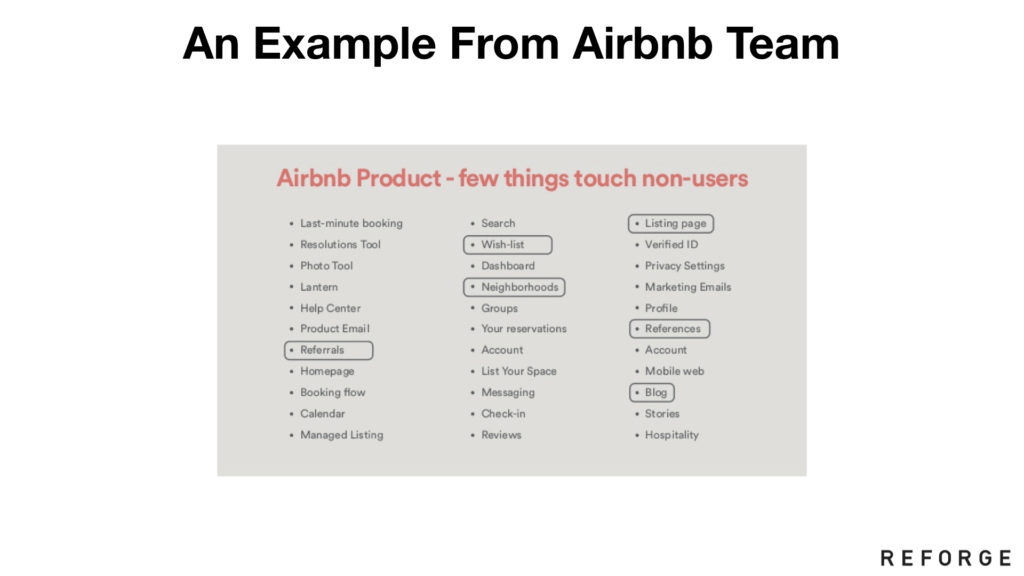
The other fascinating exercise is to look through your existing features and roadmap and circle everything that touches non-users (or inactives) as opposed to active/core users. You’ll be surprised that there are generally very few.
The above was shared from Airbnb’s growth team who did exactly this exercise – only 6 items out of 33 were for non-users. (Shoutout to Gustaf, who ran their guest growth!) A growth team can rapidly expand this list and give some love to everyone out on the edges of the audience.
Above: Final topic. Let’s say that you as an individual are thinking about joining (or starting) a growth team at a company. What should you expect, and how might you evaluate the opportunity?
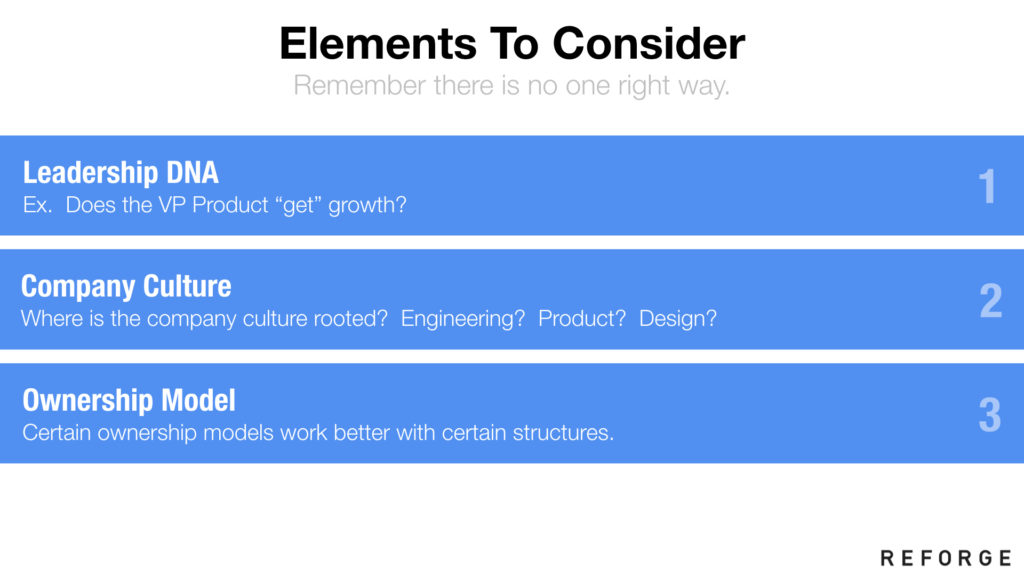
Above: There are a lot of organizational and cultural aspects that can get in the way of setting up a successful growth team. First, there’s leadership DNA – is there an understanding of what the growth team does? In particular within the Product and Marketing peers? Or is this something that’s being forced top-down by the CEO or board without leadership buy-in? It can get painful if people don’t fundamentally get the mission of the growth team.
Company culture is an important aspect too. If the culture is like Uber 1.0’s, where experimentation is encouraged – as long as it’s scoped to a city or two at a time, or as a 1% test – then that’s great. “Move fast and break things.” On the other hand, if the company is extremely design and brand conscious, it can be harder. Famously, Apple and Snap are two companies that rarely ran A/B tests until the recent era. In evaluating a company for experimentation, it’s good to understand how open folks are to a big change to the homepage, for instance, even if it’s 1%. Or in the new user flow.
The ownership model, as previously discussed, can either on a spectrum: SWAT team model, with little/no code ownership, or strong ownership of areas like NUX/notifications/adtech/etc. Both can work, just make sure you know what you’re getting into and that the staffing reflects it.
IMHO, the best case scenario, in my opinion, is to have a team that is:
- Bought into having a growth team, and knows how it compliments the existing functions
- Supports experimentation, even extreme as long as its tested with a small group
- Dedicated staffing that’s already in place, with a bias towards strong ownership on for everything outside of the active user base
The worst version, of course, is where people don’t really get why you have the growth team, there’s a ton of risk aversion on rapid experimentation, and no staff… just an expectation to run around and convince other teams to build your amazing ideas. That’s a recipe for failure.

Above: There are common lines of disagreement to implementing a growth team. Sometimes the incentives of a company are set up to reward large, complex projects (with codenames and executive oversight) rather than many lightweight changes that move the business along. This can get baked into everything from how projects are reviewed to perf review, to everything else.
Similarly, before starting a growth team, almost certainly there were also folks looking after growthy parts of the product. By moving those responsibilities away, or starting to encroach on “engagement” which overlaps with the core product team, there can be anti-bodies that make growth projects much, much slower.
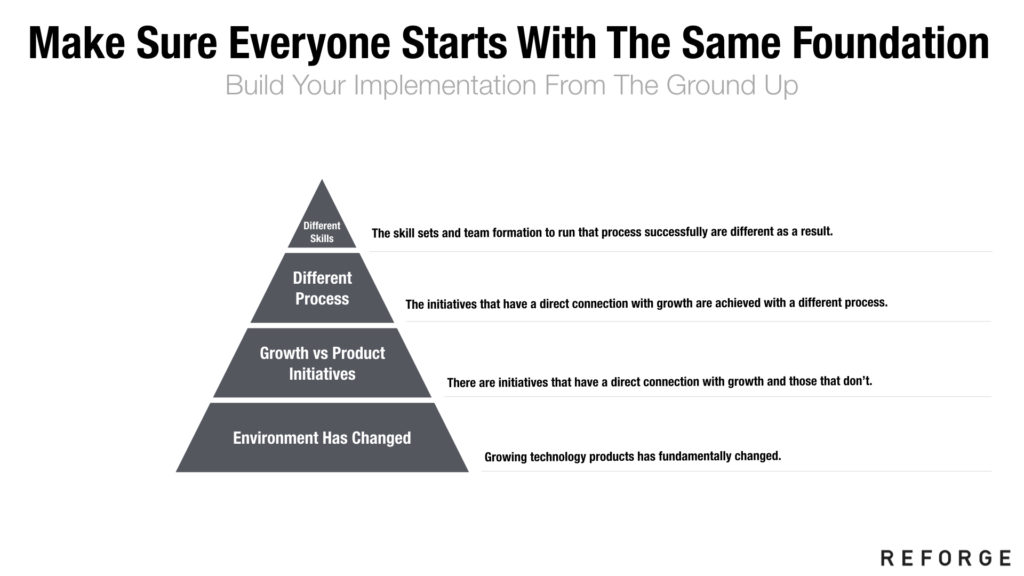
Above: The foundation of the organization has to be ready to accept a growth team, and that starts with a fundamental understanding that the environment has changed:
- Growing tech products has changed, and the playbook has changed in the last decade
- Explicit headcount/roadmap has to be dedicated towards making growth happen – “build it and they will come” doesn’t work
- Creating a pipeline of growth experiments will need a different process. The scientific method as applied to KPIs. Not just a subset of marketing and product projects
- And finally, the team structure and skillsets to make this successful are different
As you might imagine, creating this foundation of mutual understanding is a big effort by itself. And y0u’ll need the help of your startup’s CEO, or your business unit’s GM, and the layer above them too. And all your peers.
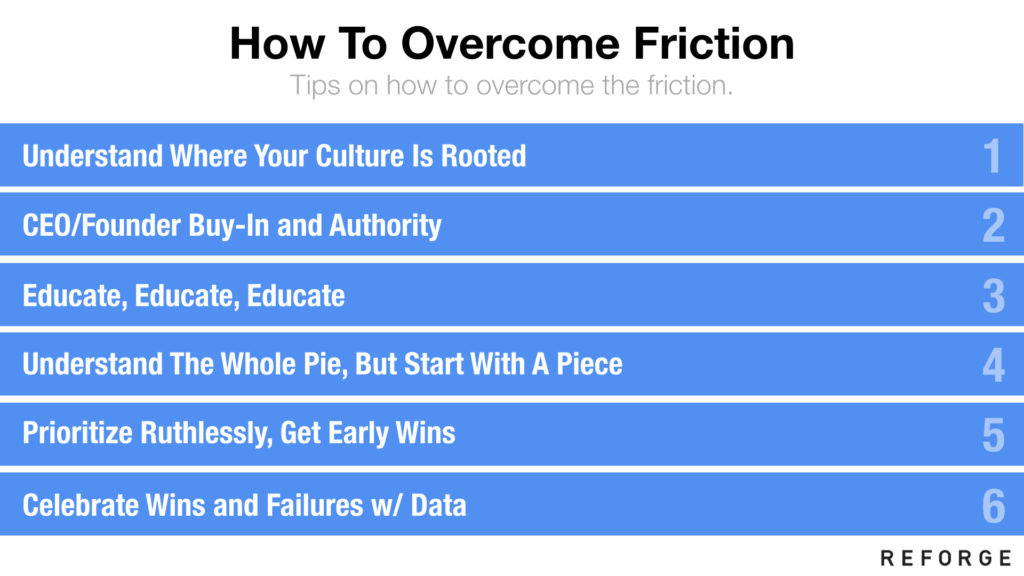
Above: There are tactics to overcome the inevitable organizational friction you’ll hit. Here are a few of them.
OK, that’s all folks! Thanks for reading this far, and hope you enjoyed this deck
The red flags and magic numbers that investors look for in your startup’s metrics – 80 slide deck included!

Growing startups and evaluating startups share common skills
Earlier this year, I joined Andreessen Horowitz as a General Partner, where I focus on a broad spectrum of consumer startups: marketplaces, entertainment/media, and social platforms. This was a big moment for me, and the result of a long relationship that began a decade ago, when Horowitz Andreessen Angel Fund funded a (now defunct) startup I had co-founded. One of the reasons I’ve been excited about being a professional investor is the ability to apply my skills as an operator. The same skills needed to grow new products can be used both to evaluate new startups to invest in, and once we’ve invested; to help them grow.
The reason for this is that the steps for starting and scaling a new startup share many of the same skills as investing in a new startup: 1) First, we seek to understand the existing state of customer growth – including growth loops, the quality of acquisition, engagement, churn, and monetization. 2) Then, to identify potential upside based learnings from within the company as well as across benchmarks from across industry. 3) And finally, to prioritize and make decisions that impact the future. Of course, as an investor you can’t run A/B tests or analyze results directly, but you can form hypotheses, ideate, and apply the same type of thinking.
As part of my interview process at a16z, I eventually put together an 80 slide deck on how to use growth ideas to evaluate startups. In the spirit that this perspective can help others in the ecosystem, and to share my thinking, I’m excited to publish the deck below.
Disclaimer: This was just one presentation in a 10 year relationship
But before I fully share, I have a disclaimer. This is one presentation I made within a series of dozens of meetings and interactions I had with the Andreessen Horowitz team. It was just one ingredient. I’ve been asked by friends and folks on the best path into venture capital. From my experience, it’s a long, windy experience – others have written about their processes as well.
My journey took a while too:
- 10 years in the Bay Area (and blogging, building my network, etc)
- Dozens of angel investments and advisory roles in SaaS, marketplaces, etc
- Once kicked off, 6 months of interviews (dinners, sitting in pitches, analyzing startups)
- 100+ hours of interviewing and prep
This deck was just one step, but one that I’m proud of, and want to show y’all.
The Deck

Above: I presented this deck as part of my interview to join Andreessen Horowitz to help demonstrate my expertise and “superpower” and how it might be used in an investing context.
As a result, it’s split into three sections:
- About me and my superpower
- How to apply user growth ideas in an investing context
- My continuing leadership in the field
Let’s get started!

Above: When I first arrived in the Bay area, if you had searched for “growth hacking” – you would have gotten zero results. It wasn’t a thing. Some early companies like Linkedin and Facebook had started the notion of “growth teams” but this wasn’t a widely understood set of ideas in the industry.
While there were people thinking about user acquisition and ad tech, and some early consumer teams (like Eric Ries’s IMVU) thinking about cohort curves to mention retention, it hadn’t been centralized into a team that could execute against it.
I started my blog originally to write down everything I was learning. My previous background up to that point was in user acquisition and ad tech, and I was making the pivot to consumer products. There was a lot to learn.
As I learned from the best in the industry – in particular from the PayPal mafia who had employed a metrics-driven viral approach to build some of their most iconic companies – I started to write about what we’d now call growth.

If you look at Google Trends, you’ll see that “growth hacking” all of a sudden became a term people in the industry were interested, and were searching for, in 2012.
There’s a reason for that. I’d like to take some credit :)
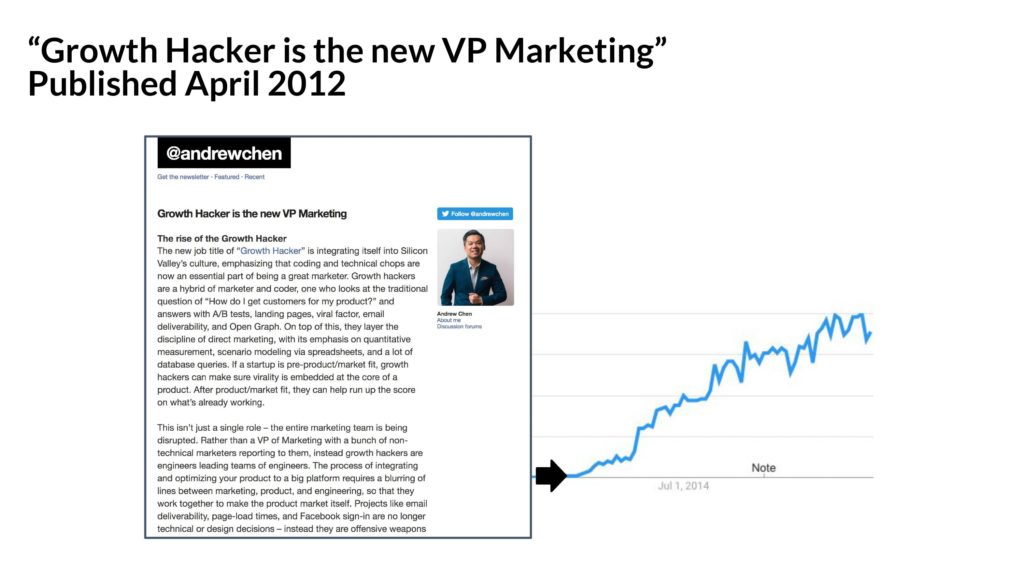
I was lucky with the right timing, the right content, and with inspiration from my friend Sean Ellis to be able to popularize the terminology and ideas around “growth hacking” in an essay I wrote in 2012.
And these days, it’s spread and become its own ecosystem.
Teams focusing on user growth have spun up across some of the best companies in the ecosystem!
(As of early 2018, when I had presented this, these were some of the companies that had growth titles or formal growth teams)
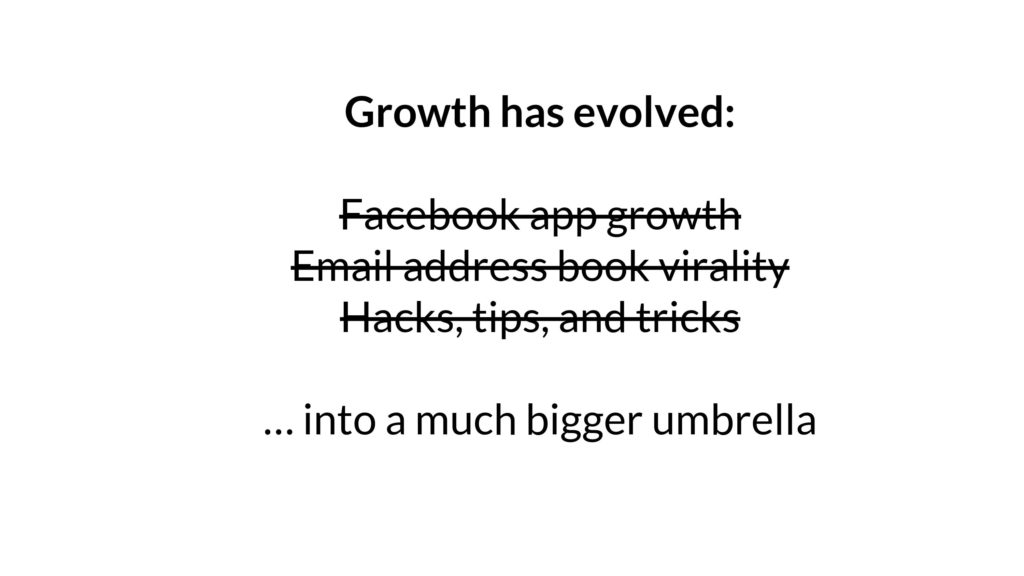
Of course “growth hacking” has changed a lot – it’s no longer about hacks as much as a much bigger umbrella as it’s become a more professionalized, formal function within a team.
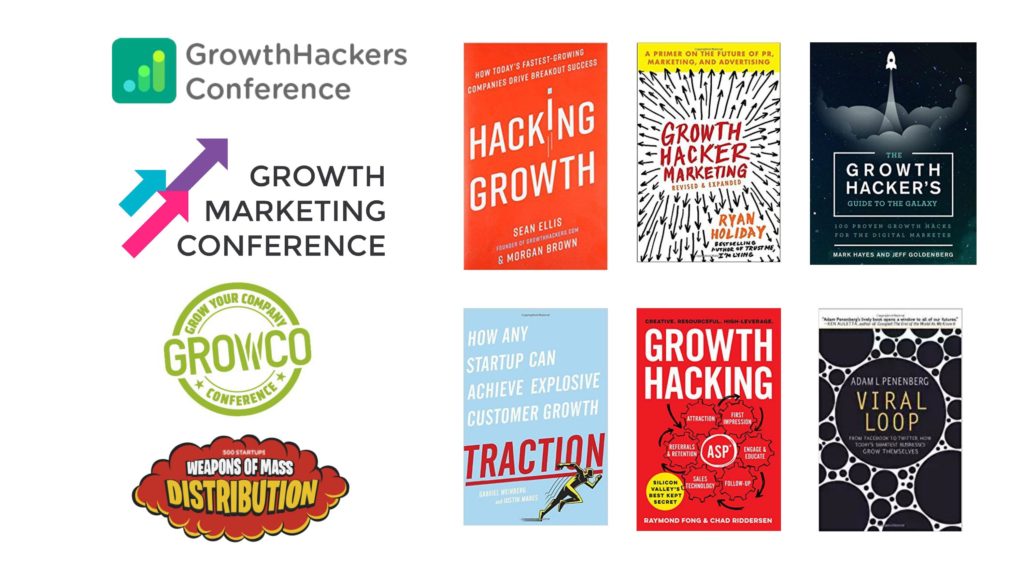
One evolution is the number of books and conferences now dedicated to growth.

The other evolution in the ecosystem is that people are thinking about different things – about how to build growth teams, not just hacks. Thinking about new user experience, engagement metrics, and other important concepts.
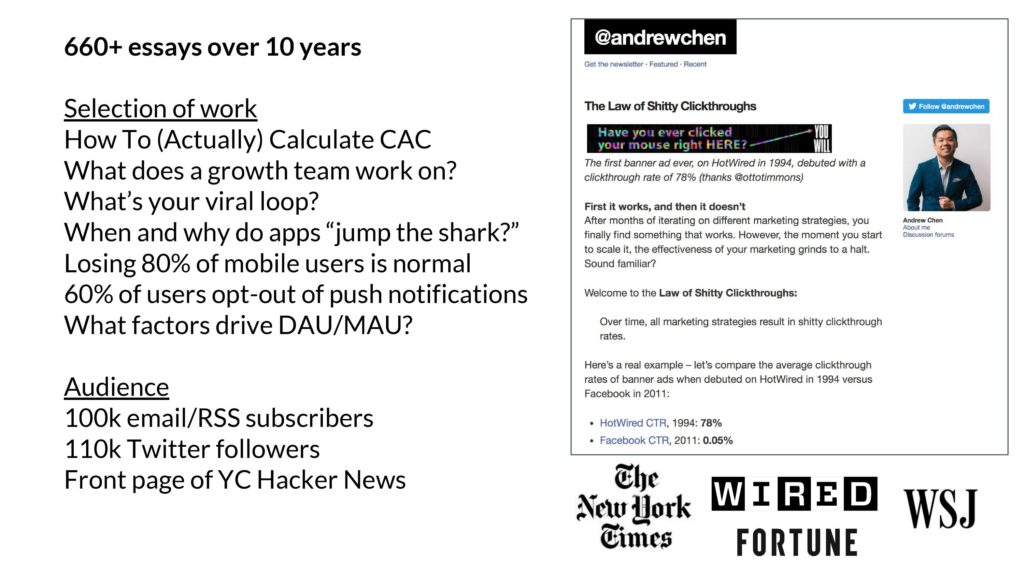
I continue to contribute to this ecosystem by writing, being involved in social media, and press.
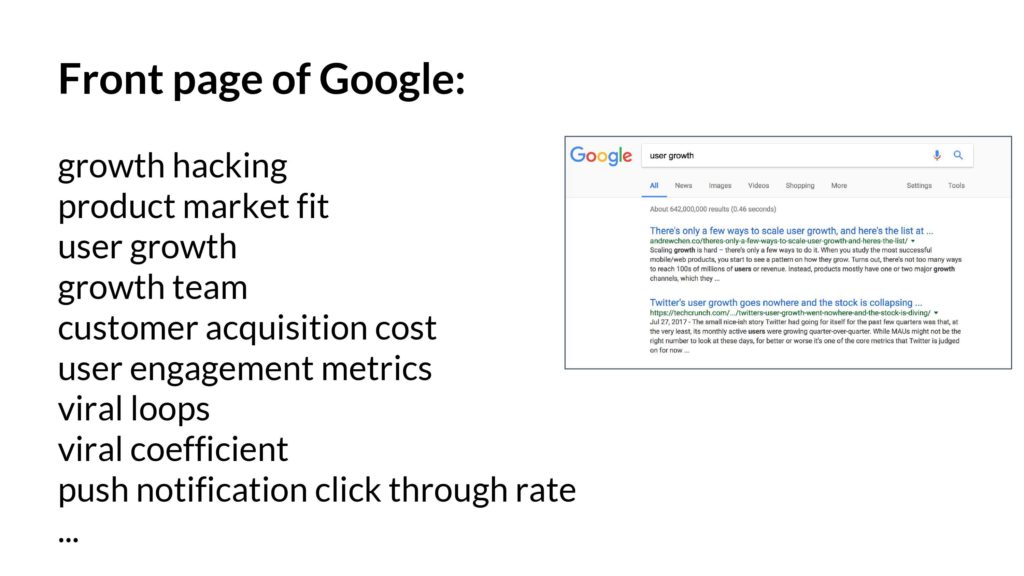
As part of that, as folks search for important concepts like “product market fit” and “user growth” – my essays are often on the front page. These are evergreen concepts and were relevant 5 years ago, relevant today, and will be important in the next phase of tech as well.

Beyond writing, I’ve also extended my efforts to bring together the high-end professional network of people working on startup growth. This hits a different part of my network as it’s a deeper relationship, and Bay Area focused, as opposed to my essays and social media which are global.
To accomplish this, I’ve been working with Brian Balfour (ex-VP growth from Hubspot) to start up Reforge which has educated 1000s of employees from top tech companies.
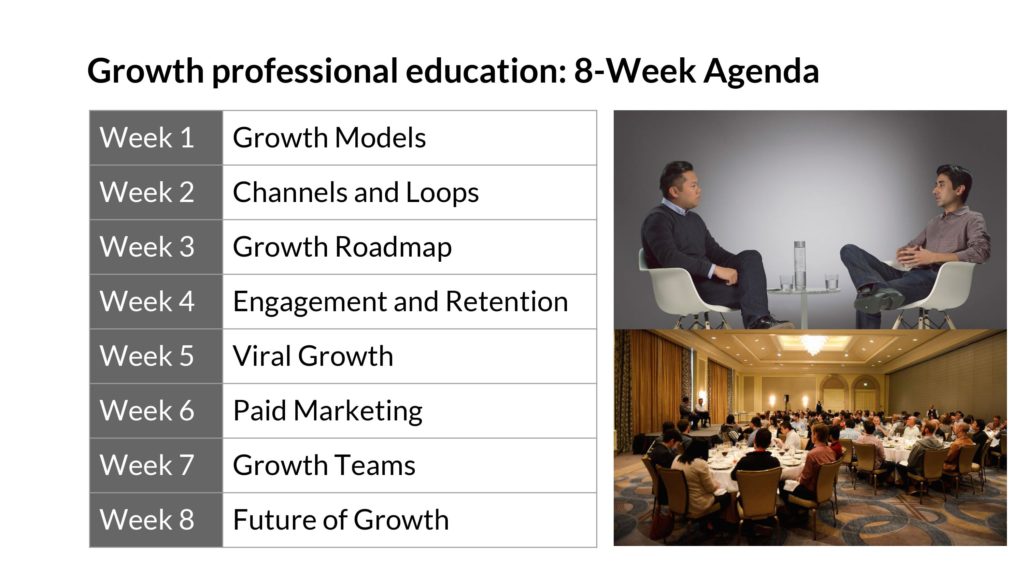
The flagship program on growth is 8 weeks and pulls together some of the foundational concepts.


The speakers include executives who run growth or related functions from across the industry. (Thank you to all the wonderful people who are involved with Reforge! Y’all are awesome and I’m happy to count you as my friends)
In the past few years, over 1500+ folks have attended the program from almost every company in the Bay Area and many F500 enterprises as well. This includes CEOs/founders, VPs, PMs, marketing folks, data science, engineers, and so on.
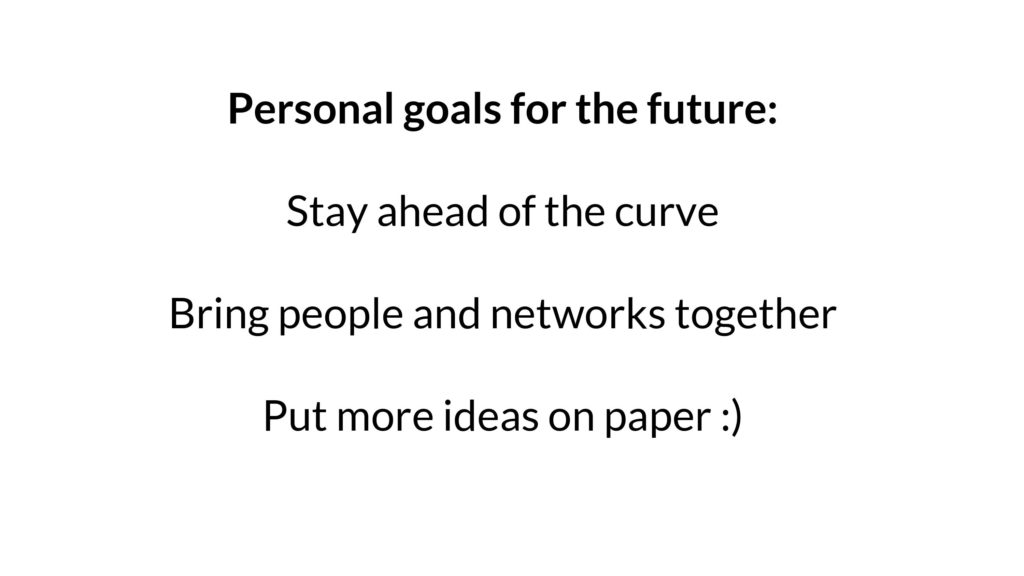
In the coming years, I want to stay as active as possible – to stay ahead of the curve by spending time with the smartest people from across industry, to bring communities together, and to continue to publish ideas. Establishing myself in the industry has taken a decade in the Bay Area and I intend to spend the next few decades at the same pace!
Next, let’s change gears. After all this talk about startup growth, how might you use this to evaluate new products in an investment context?
In this next section, I’ll present some of the central ideas in user growth and how you might use that to evaluate the quality of a startup’s growth as opposed to getting stuck on vanity metrics.

Above: To start, oftentimes you’ll find a new startup that presents their growth curve, which might look something like this – up and to the right! This is great. Time to invest, right?
The problem is, you don’t know where it’s going to go.

In the long run, over the course of an investment, you’ll find that this curve might go in a direction you may not want it to go – perhaps it’ll plateau. Perhaps it’ll even collapse. Or you may find that it’s going to continue going up, and even hockey-sticking.
How do you predict the future? Is it working and will it sustain? Will it even accelerate?
There’s a couple common frameworks to try to understand this, and one is the Growth Accounting Framework.
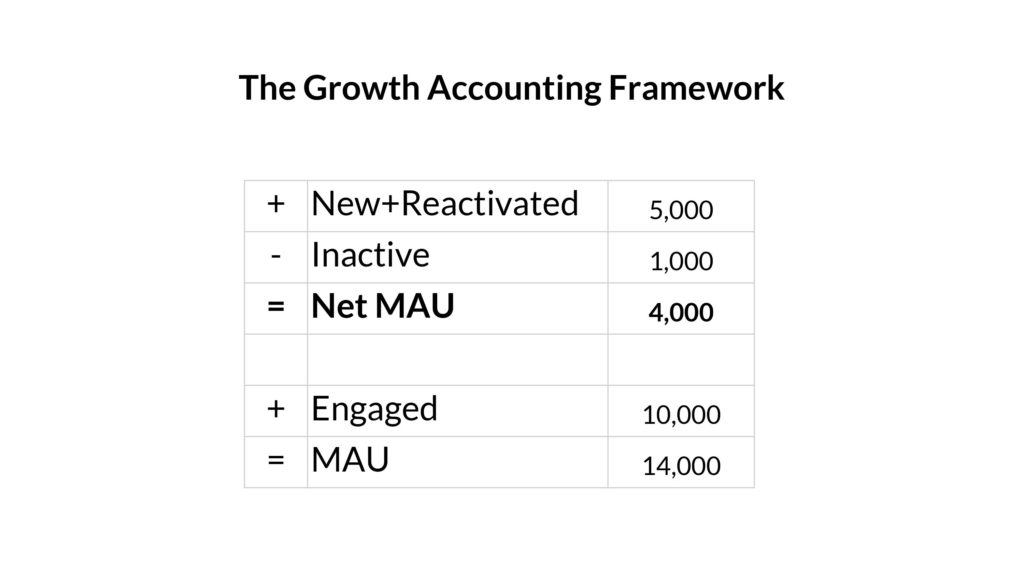
The Growth Accounting Framework looks something like this – within each time period (say a week, or a month) – you’ll add some users, reactivate some folks who had previously churned, and some go inactive. You add this up and it’s the “Net MAU” for a product – the difference between each time period.
If your positive terms (New+Reactivated) are smaller than your negative terms (the number who become Inactive) then you stop growing, and the whole thing goes negative.
Let’s look at each term in isolation.

The New+Reactivated term tends to look linear or be an S-curve. The reason is that it’s really really hard to scale acquisition – only a few, like viral loops, paid marketing, and SEO can bring you to millions or tens of millions of users. And as the acquisition channel gets bigger, it tends to get less effective. Ads become more expensive to buy, viral loops end up saturating your target market, etc. This term dominates.
Reactivation tends to be hard to control. If someone quits your product, emailing them a bunch of times probably won’t help. (But if you have a network, something like photo-tagging or @mentions might!). But most products don’t have a network, and as a result, the acquisition term tends to be much bigger than the reactivation one.

Above: The Inactive curve is also an S-curve, but it lags acquisition. It’s simple to understand why, which is that until you have a base of active users, you can’t really churn. You can’t churn anyone when you have zero users. So it goes up over time. So usually your acquisition curve pushes you up, and then churn starts.
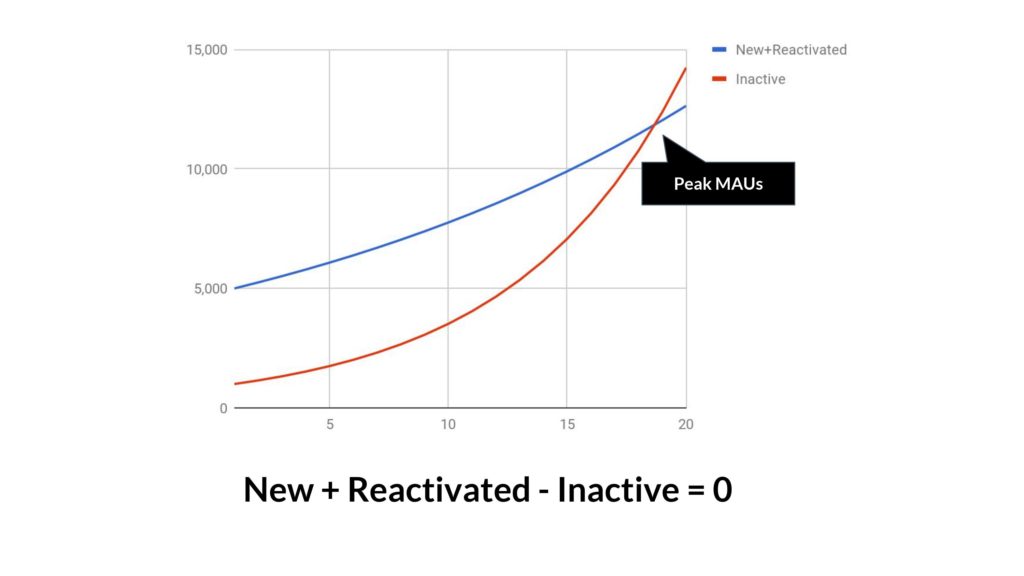
At the moment that your New+Reactivated is equal to your Inactive users, each time period, then you hit peak MAUs. This is the thing to watch for, because then it’s all flat or down from there.
I use MAUs in this example but you could also use active subscribers, or users who have bought something in the past 30 days, or some other definition. The underlying physics are the same.
If you’re following all of this, it’s already a pretty profound insight. We’ve moved from looking at a single curve that might have been growing and decomposed it into its underlying terms, and shown how a curve that’s been going up and to the right for a while might go flat the next month. And why. That’s important.
But there’s a problem.
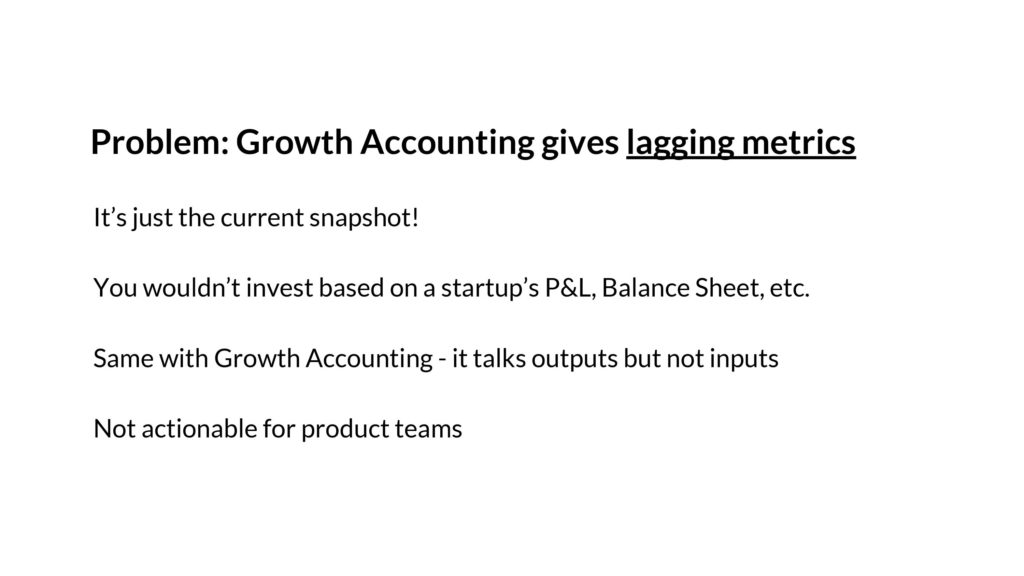
The problem is that the Growth Accounting Framework provides for lagging metrics. It’s hard to predict the future. It’s the equivalent at looking at company’s current year P&L and its constituent parts – it’s useful, but not enough. It’s hard to be predictive. It’s also hard to be actionable for product teams.
That’s why for the growth and product teams I’ve advised over the years, this isn’t something you can look at every day or every week. It’s not helpful.
Instead, you need leading indicators and a more predictive conceptual model.

Above: To do this, I advocate that we look at two key loops:
- Acquisition loops, which power the positive term for New
- Engagement loops, which power the negative terms on Reactivation and Inactive
Understanding these underlying loops is the key to the whole problem of predicting where a graph is going to go.
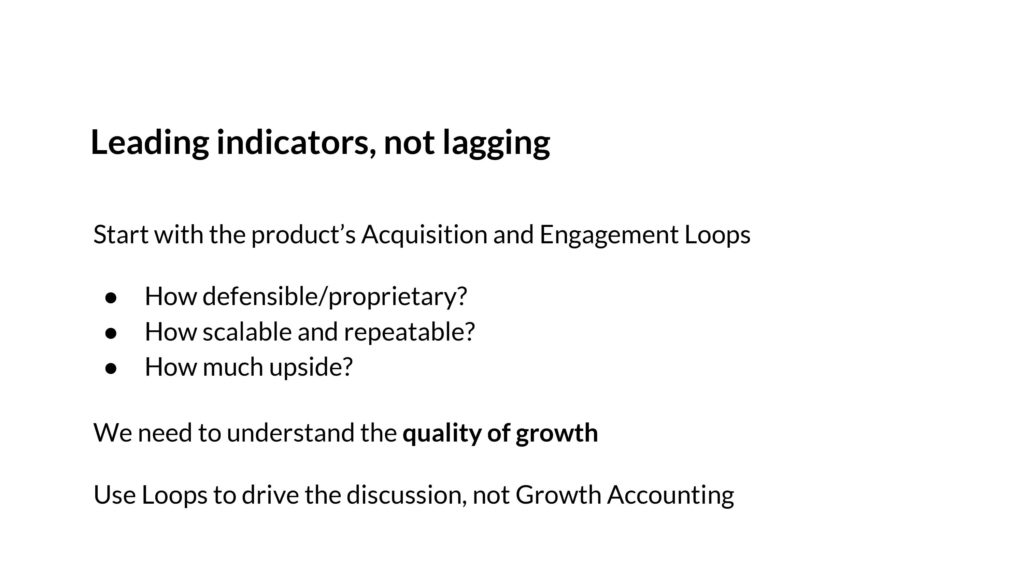
In understanding these loops, I don’t mean to simply chart them out in a spreadsheet. I mean to think about the quality of the loops – how defensible and proprietary are they? How scalable and repeatable? Is there upside in optimizing them or adding to them further?
In other words, we want to understand the quality of the user growth. If we understand that, we can forecast into the future as opposed to looking backwards.

To start, let’s look at the Acquisition Loop.
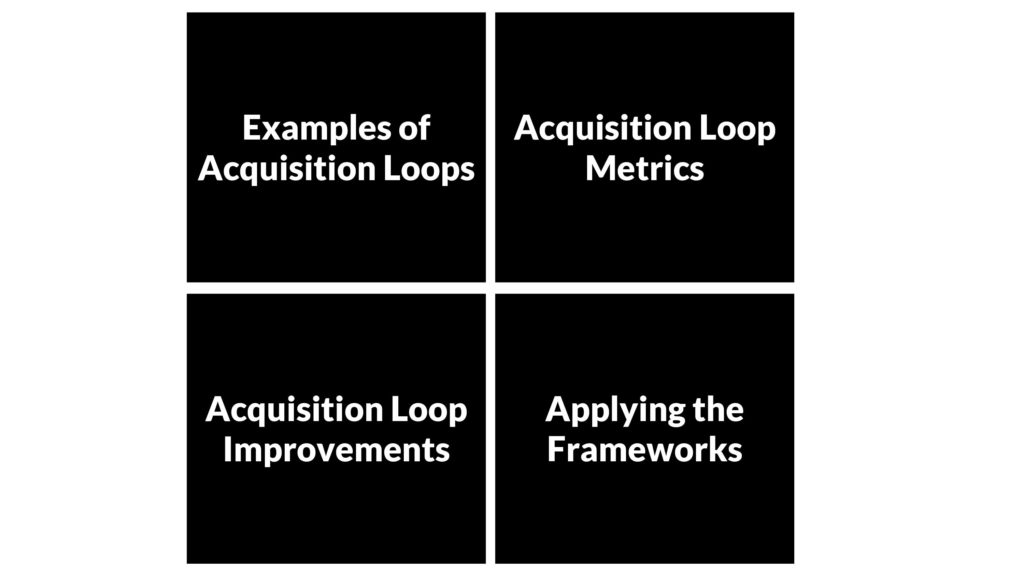
Above: There’s 4 sections of content we’ll go through- first, to understand the examples, then what metrics to examine. Then to look at how to best improve the loops. And finally, we’ll try to apply the framework.

Let’s start with examples.
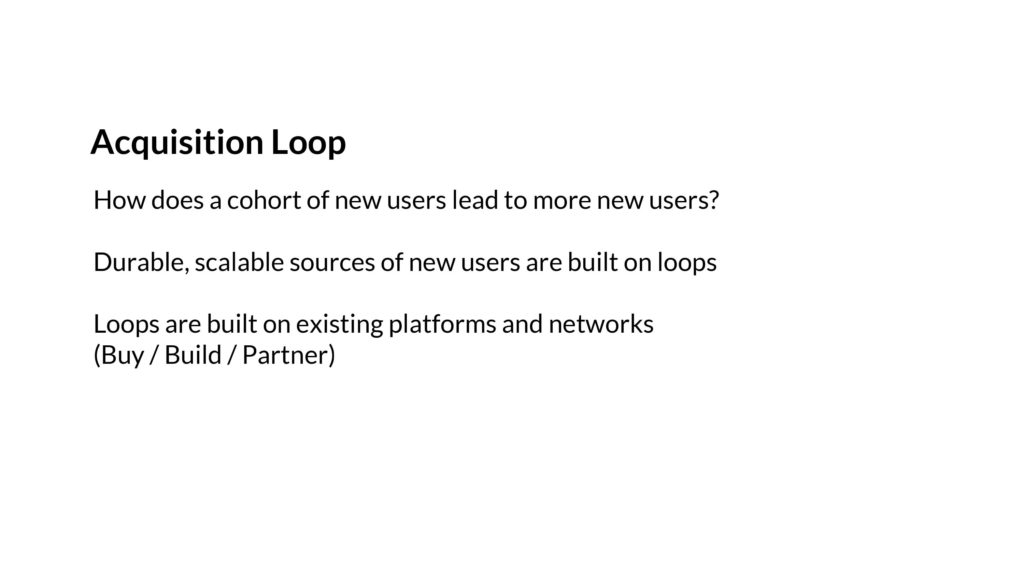
Above: The key thing to ask for the Acquisition Loop is to understand how a cohort of new users leads to another set of new users. If you can get that going, then by a conceptual proof by induction, you’ll be able to show how it scales.
Importantly, these loops are flows within the product that are created on top of pre-existing, large platforms. Sometimes the loops are built because they are bought – via Ads. Sometimes they are built via API integrations, to allow for easier/faster sharing. And sometimes it’s via a partnership.
Let me talk through some examples.

A product like Yelp or Houzz fundamentally is a UGC SEO driven loop. New users find content through Google, a small % of them generate more content, which then gets indexed by Google, and then the loop repeats. Reddit is also like this. So is Glassdoor. And so on.
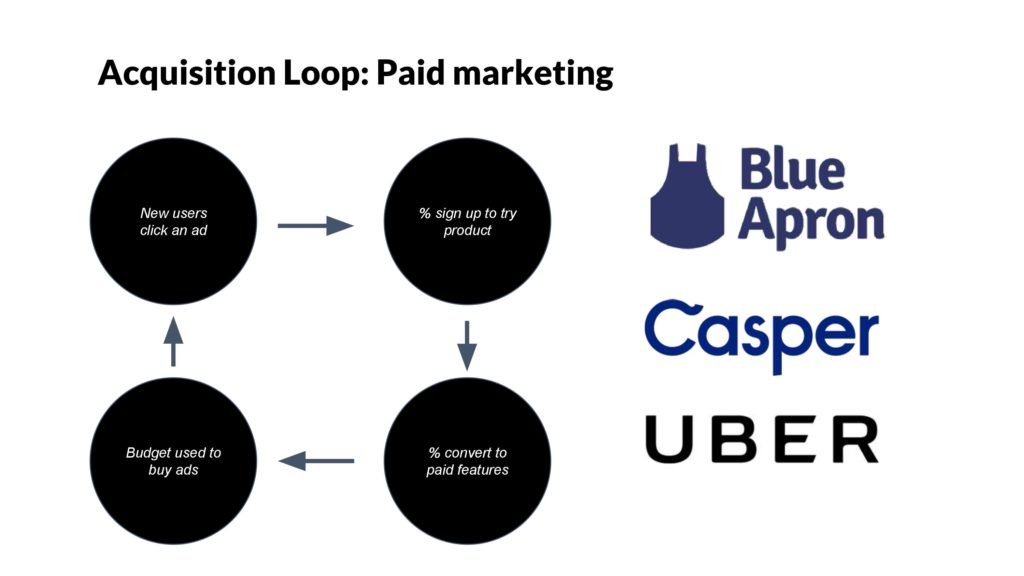
Paid marketing is also an obvious loop. Spend money, sell products, take the money and buy more ads. Keep going.

Above: Viral loops are important because they are extremely scalable, free, and don’t require a formal partnership. This is based on users directly or indirectly sharing a product with their friends/colleagues, and having that loop repeat itself.
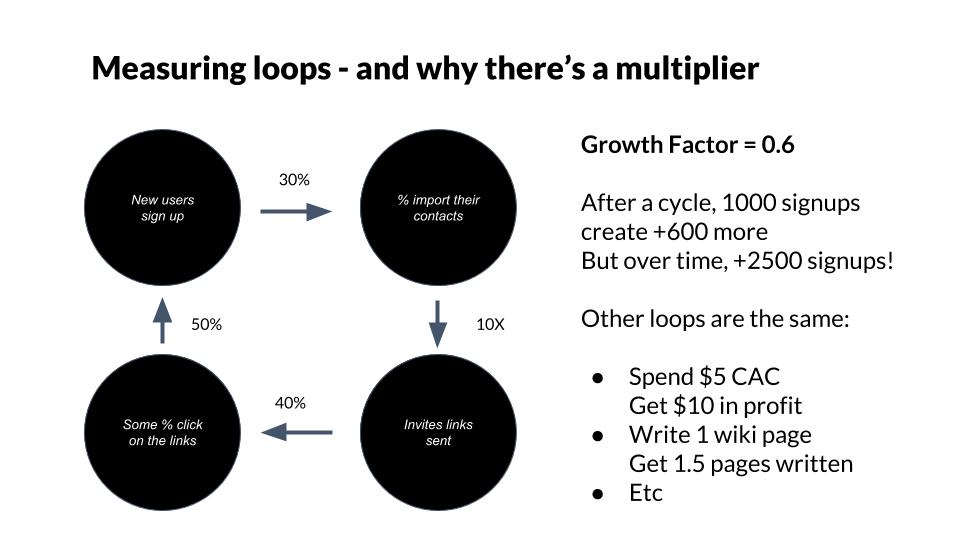
The important point here is that loops aren’t just conceptual, but you can actually measure their efficiency as well. If you can get 1000 users to invite and sign up +600 of their friends, then you have a ratio of 0.6. But that’s just in the first cycle of the loop. But then those 600 new users generate 0.6*600=360 new users, who then generate 216, and so on, until the entire cohort is +1500 signups total from a base of 1000. Wow! That’s meaningful because then for every user you get through other means, you’re amplifying their effect.
This can be particularly important when you have a large paid marketing budget, because it can drive down your cost of acquisition by blending in a scalable form of organic. It can be a huge advantage.
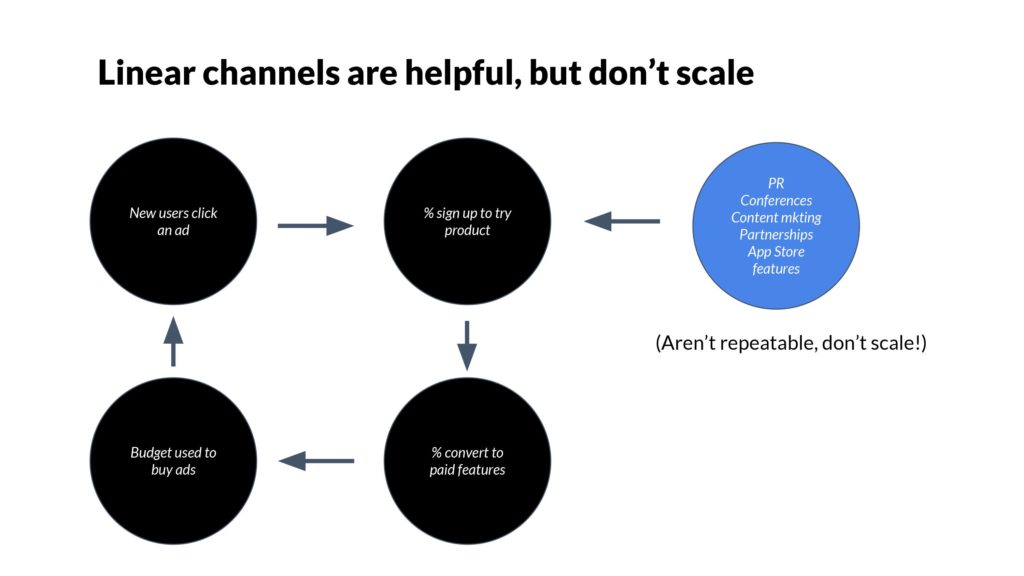
Above: What about PR, conferences, in-house content marketing, etc.? Aren’t they important? Yes, they can be- but they don’t scale. For example, conferences happen irregularly, have poor ROI/attribution tracking, and every dollar made from a conference can’t quickly be reinvested. Contrast that to paid marketing, which can be highly accountable, become very optimized, and can scale to $1B+ spend/year.
So when it comes to PR, conferences, partnerships, etc. – they’re useful, but they are more like one-off opportunities, and certainly not where the bulk of your customer acquisition takes place. Instead, you use them to drive traffic into your loop, which then gets amplified.
As a result of this model of linear channels versus loops, when you are meeting a company for the first time, you have a framework to understand if their growth will scale over time or not. If it’s a one-time launch, like they just got announced as part of the latest YC batch, well that’s not a loop.
If they have been quiet on PR, conferences, etc., but users are telling each other as part of the native functionality of the product – okay then you have my attention!
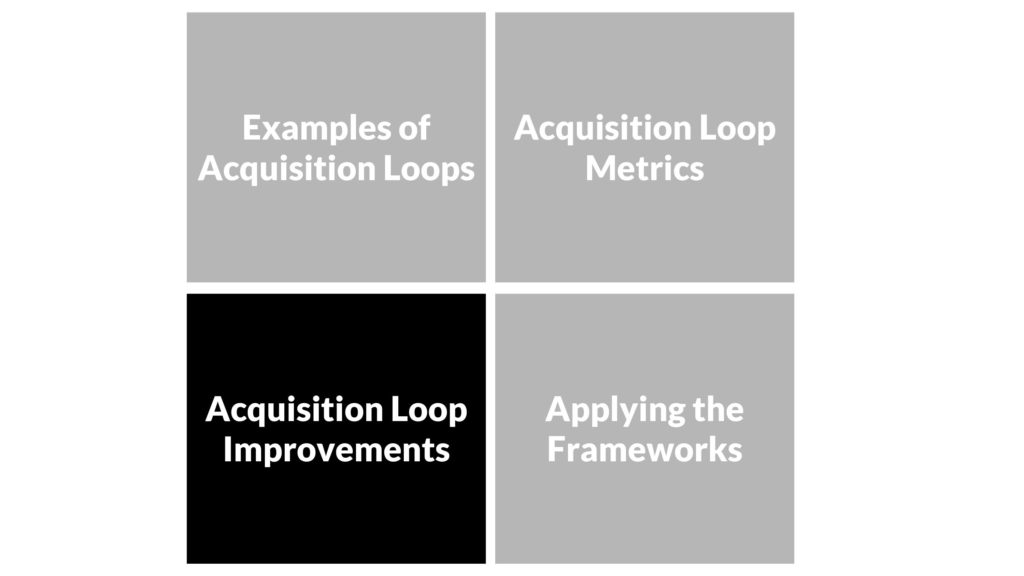
Once you understand the loop, you have you understand if there’s upside. Is it possible to improve the loop? Maybe it sucks now, but maybe it can be fixed? Or even better, maybe there’s a product growing like gangbusters but you could accelerate even further.
To understand this, you have to move out of spreadsheet world and get into product experiences.
The first move is to decompose the simplified loops we were looking and actually get into the details.

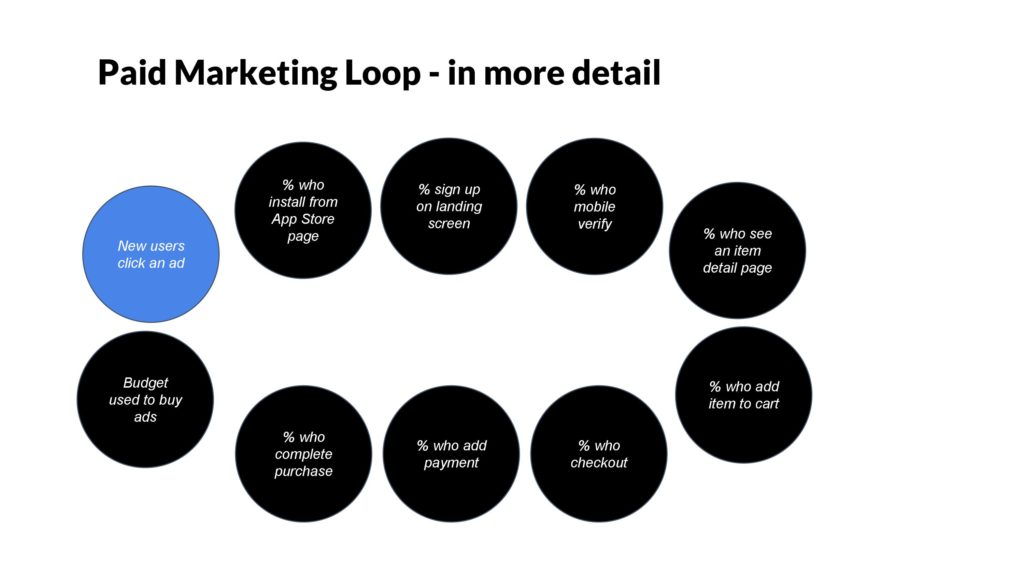
Above: Instead of just 4 steps, as shown before, now we go even more tactical. Of course new users will have to land on the app store page, then sign up. They have to mobile verify. They have to go to a certain screen on the product, then add something to their cart – hypothetically. And so on. Each step is friction. Each step drives down performance.
We ought to be able to look at every single one of these steps and improve them further.
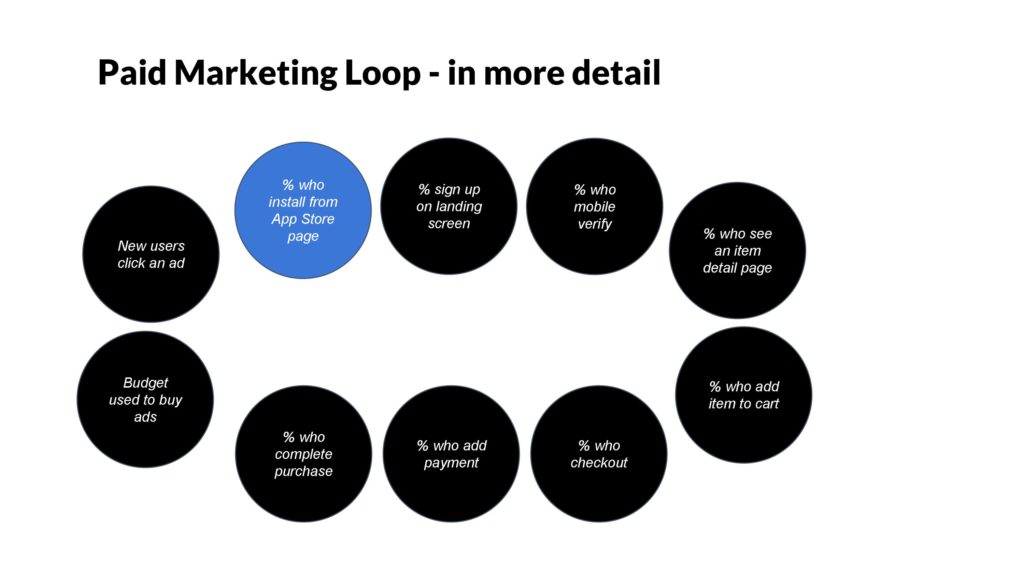
Let’s dive into one example, which is the app store screen.
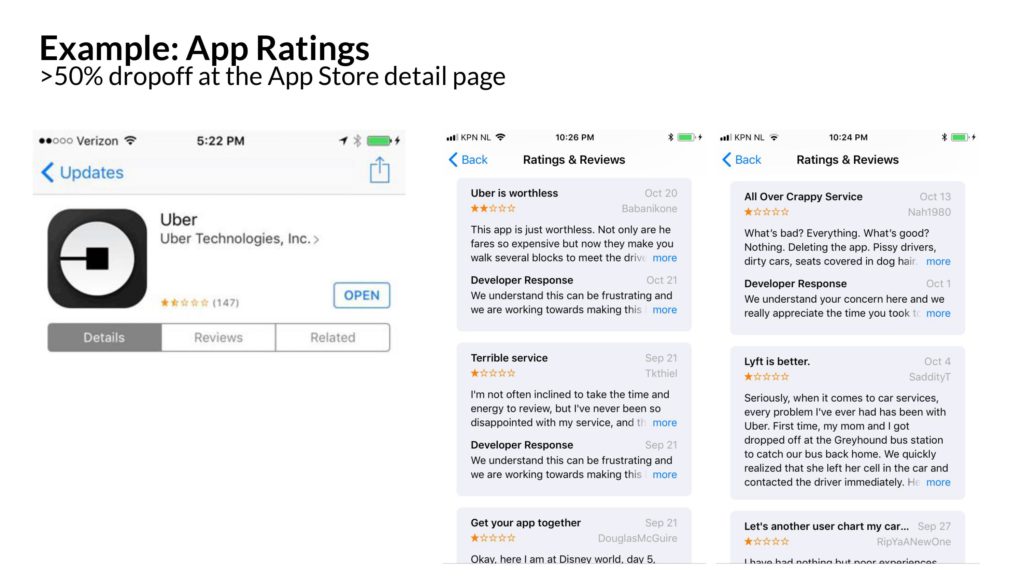
On the app store screen – and this is a real example – there’s reviews. There’s a star rating. The bounce rate on the app store screen can often be very high, sometimes 50-80%.
In 2016, the star rating on Uber’s rider app was low. 1.7 stars, in fact. Ouch.
There were a lot of reasons for this, but on fundamental issue was that only unhappy riders were rating the app. It’s a common best practice to ask a broad spectrum of users to rate your app, and the Uber app wasn’t doing that. This was controversial because there was some desire to “cherry pick” only happy riders, for fear that the rating might stay low.
Nevertheless, the best practice was implemented and shipped.
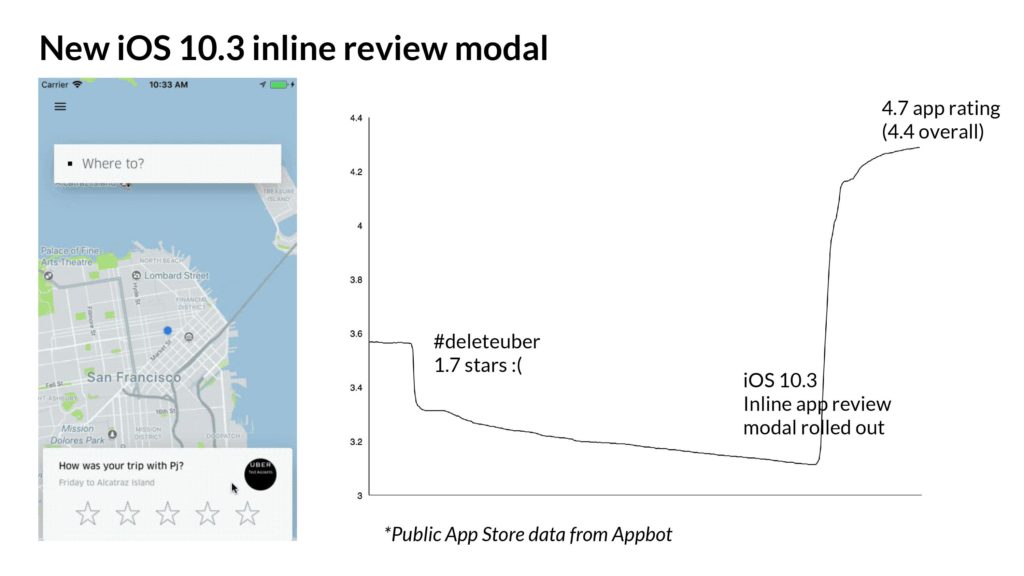
Here’s what it looked like- after a trip, regardless of what the rider rated their trip experience, it would ask the rider to rate the app. And very quickly, the 10s of millions of users who had happy, successful trips weighed in. Quickly things moved from 1.7 stars to over 4.7 stars, where it still sits today.
A change like this is worth on the order of millions of incremental downloads for Uber. It’s a small change, but had a lot of upside. (Congrats to the Rider Growth team for shipping this! Miss you guys!)
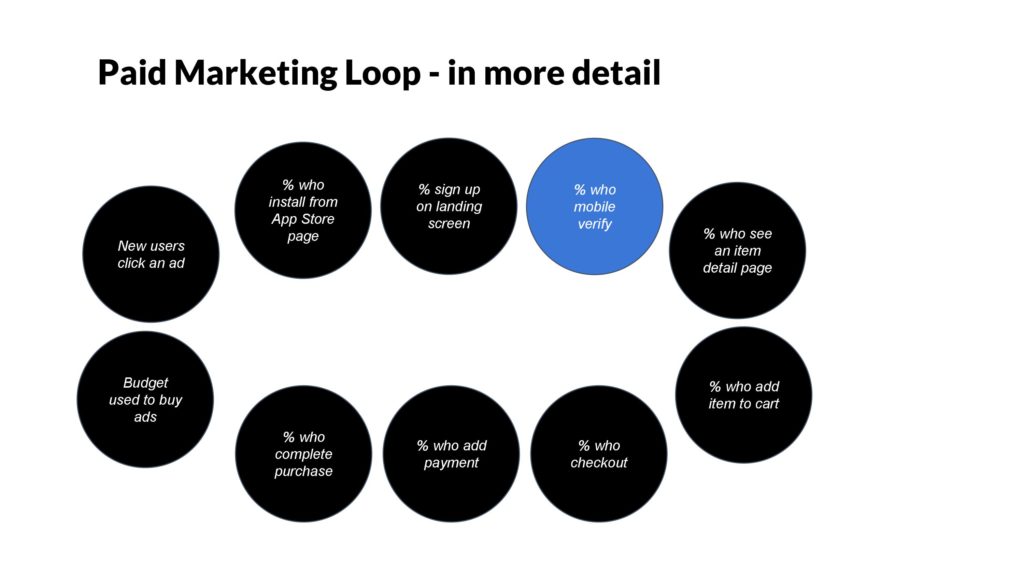
Let’s look at another example- having all of your users verify their phone numbers. You’ve done this a million times.

It turns out, having people verify their numbers is a high friction step and oftentimes, there’s a 10-40% dropoff rate just on this screen. It might be because your phone number was entered incorrectly. Maybe you’re international – an important use case for travel-oriented apps like Uber. There’s a whole series of updates you can make to improve this step – from partnering with carriers, allowing a voice call to verify, and so on.
One more example on creating upside – which is on the back part of the paid marketing loop, when a new user clicks on an ad and lands into the product. The landing page they see is important.
And it’s so important, years later, they all look the same.
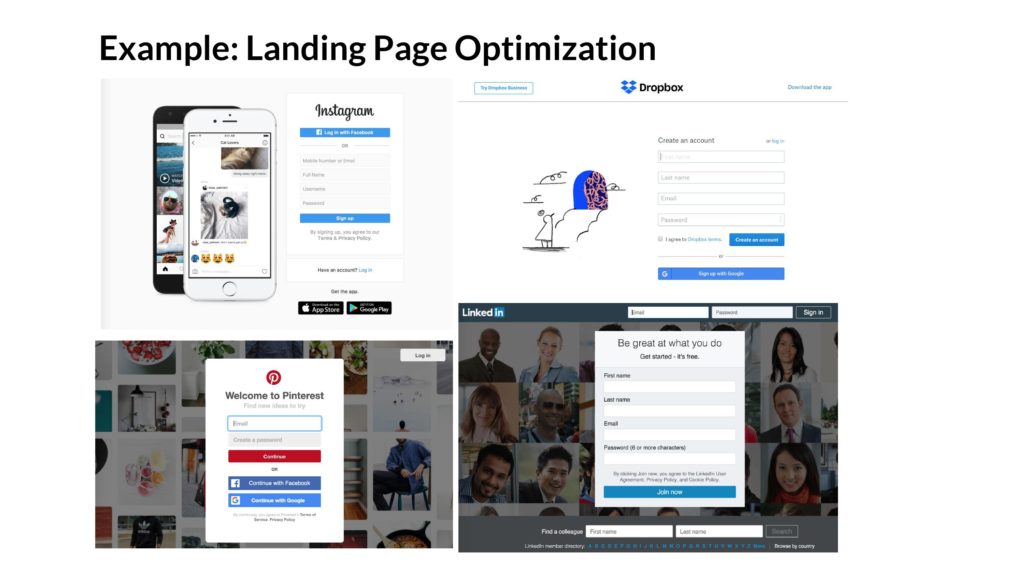
There’s a reason why so many landing pages are just signup forms. Not a ton of information about the product, not a lot of frills- just an ask to sign up. The reason for this is that after years of testing, this is what performs best when you are invited by a friend.
So if I see a startup that doesn’t directly ask for the signup, I assume there’s upside that can be gained.
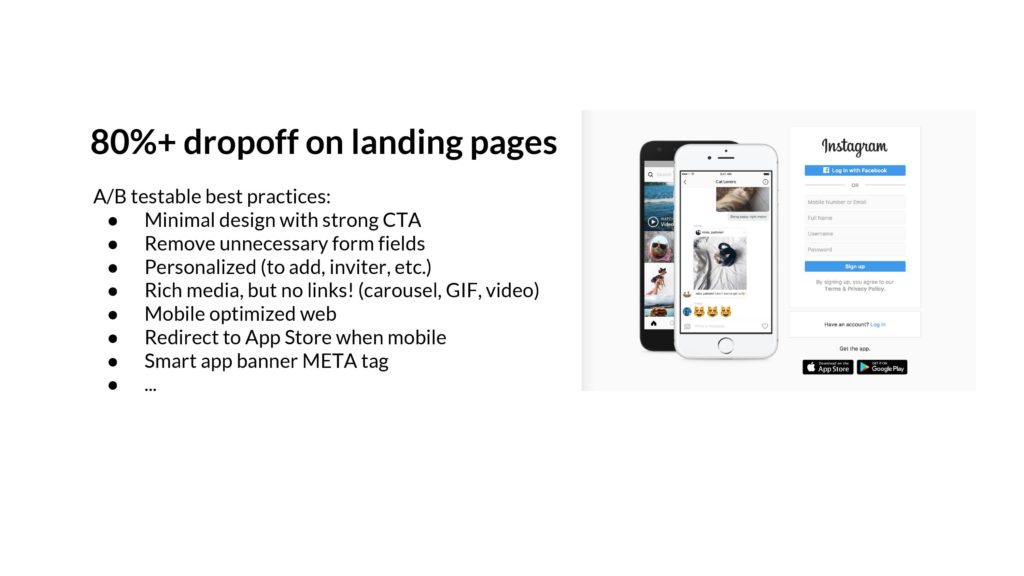
These landing pages – often the first experience of a new user – are super important because the bounce rates are often over 80%. Wow. That’s almost everyone! So there’s a playbook of common changes you can make – from removing friction, pre-filling fields, adding video, optimizing for everything being above the fold, etc.
OK, we’re done with the examples. Now once you understand the upside, let’s say you want to dig into the data. What KPIs do you look at, and what are you looking for?
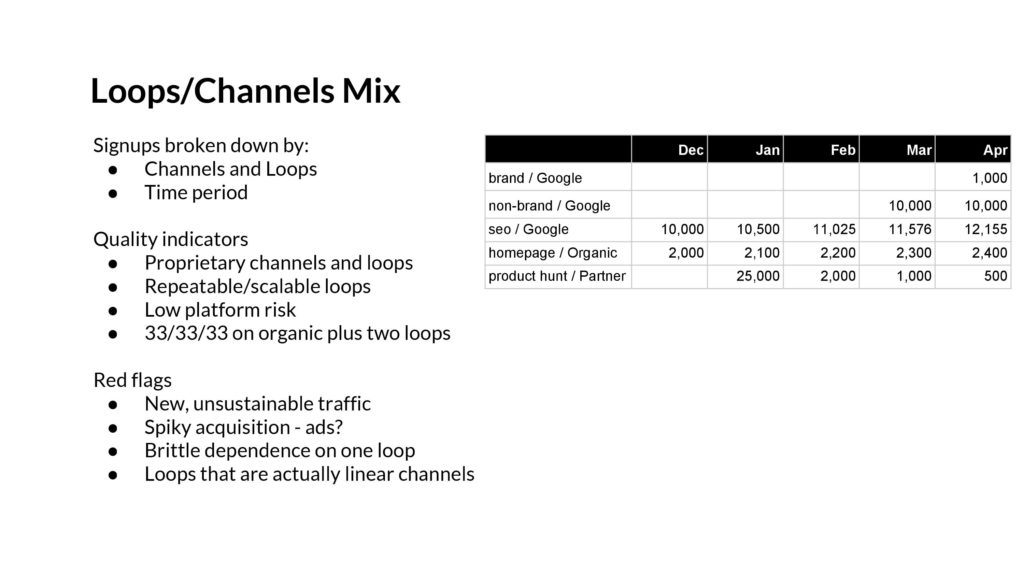
Above: The first thing to ask for is the product’s Acquisition Mix. This is a look at signups broken down by channels/loops and by time period (ideally weeks). I’m looking for signals that the dominant channel(s) are proprietary and repeatable. Ideally they are loops. I want low platform risk, where there isn’t a dependency on a larger company that might change their mind. (I.e., Instagram, Google SEO, etc.). A good mix might be 33/33/33 where you have a third organic, plus two loops, like viral and SEO.
The red flags I look for are around new channels appearing, but which aren’t sustainable. Especially ad spend that comes and goes, indicating maybe everything’s been juiced for before the fundraise. I don’t love to see spikes for that reason.
But a signup isn’t always a signup – thus it’s important to understand the quality of a signup.
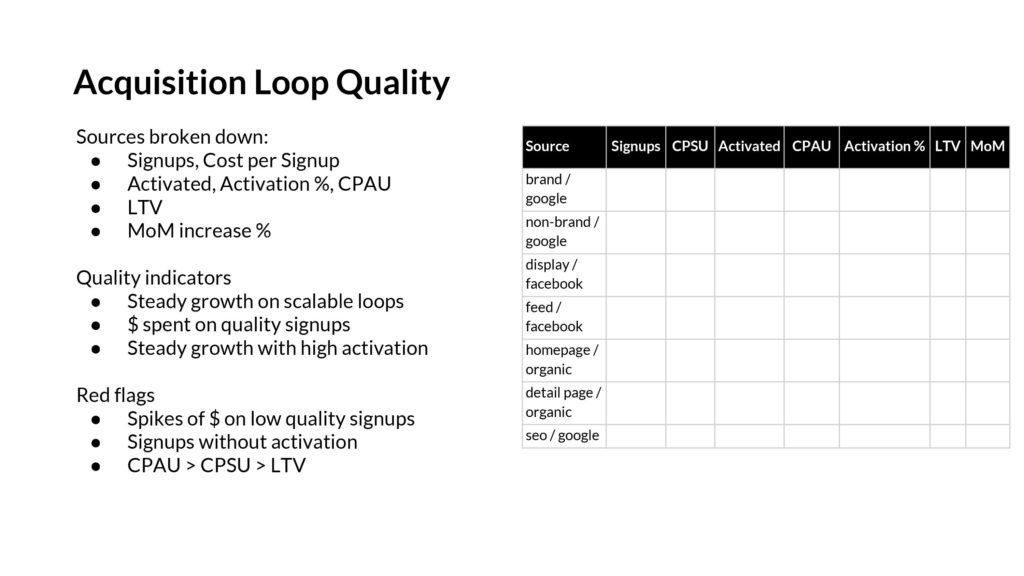
A startup shouldn’t care much about signups, they should care about how well they translate into paying customers, or active users, or whatever an “activated user” looks like. It turns out that one of the biggest determinants of “quality” of new users is the source of the user. As a result, you want to understand both how signups are being generated by various channels, via the Acquisition Mix report above, but also a sense of the quality by understanding the activation rate by channel.
The red flags here are a bunch of new users from a new channel that’s actually low quality. Or a doubling down on a new low-quality channel just to pump up the signup numbers. After all, a spike of new users count into whatever month’s MAU metric that they joined under, and it’s an easy way to juice their short-term MAU. Watch for that.
The other aspect to analyze is the concentration of new users from different sources. Perhaps a particular channel/loop dominates but seems brittle or is expensive. If all the users have come from beta users list or Product Hunt, that won’t scale over time.
On the other hand, if marketing spend and product efforts are going towards high-quality channels, that’s fantastic.

Above: As noted before, loops are usually build on top of another platform. Sometimes that’s Google SEO, email systems, Instagram, or more.
If the startup’s new product adds value to the underlying platform, and isn’t too horizontal, it might be stable. There might be a strategy to become a destination product in itself. That’d be great. But that’s often not the case.
The red flags here are focused on the integrations between the growing product and its platform- if it’s built on iOS and one of the core integrations is push notifications (like the recent live quiz apps), then look at the clickthrough rate trend for the notifications. If it’s decreasing over time, then you know it’s not working. Or on a per user basis, perhaps the average user is tapping through on the first push but isn’t engaging much with the fifth. Or perhaps the underlying platform is shrinking. If you built a product that depended on AOL Instant Messenger to thrive, that’s not a smart bet.
It’s important to understand the underlying platform of any acquisition loop because things can collapse quickly.
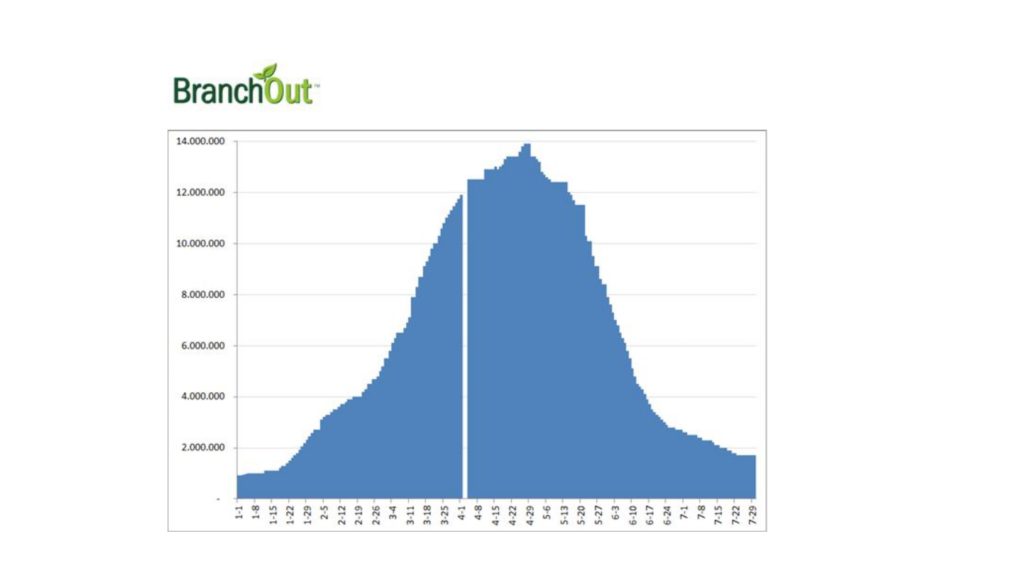
One cautionary tale is what happened with Branchout, which was trying to build a Linkedin on top of Facebook Platform. You can see how fast it grew – to 14 million Daily Active Users, and how it was 1/10 the size just 4 months later. You don’t want to invest at its peak.
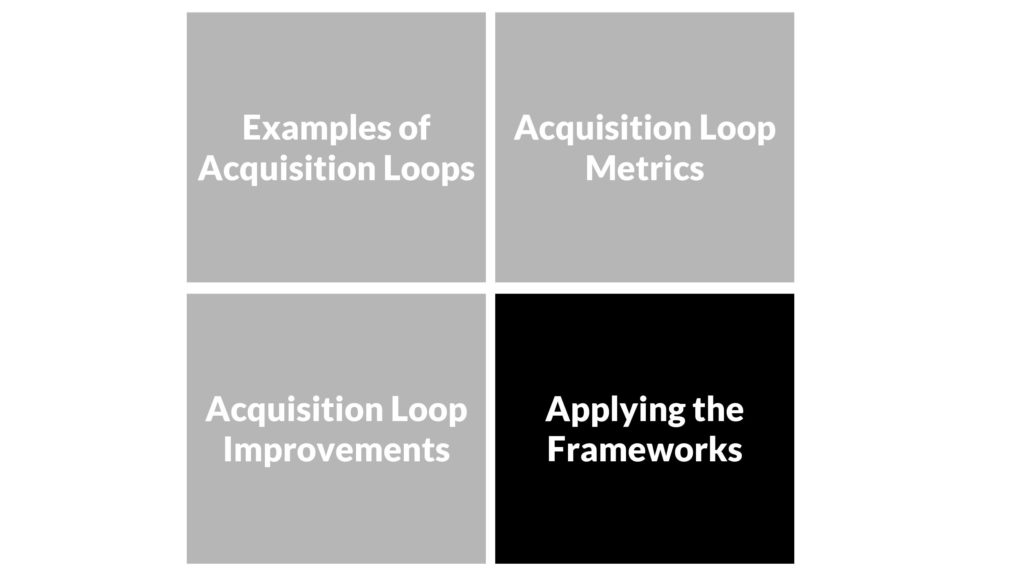
Once you understand the acquisition loop concept, can forecast the upside, and have metrics to look at to evaluate quality- then it’s time to go back to our original challenge: The up-and-to-the-right graph.

OK so does this go up, or not?
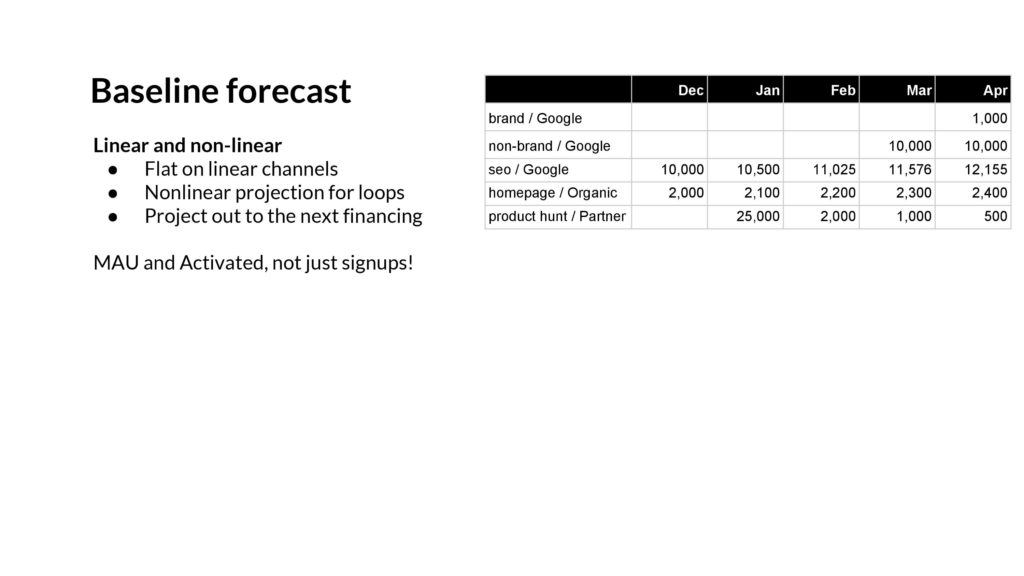
The key here is to ignore the graph, and instead use all the tools we discussed to create a baseline forecast on the engagement and user growth. Do the signups stay linear? Grow as a percentage over time? Or go flat?
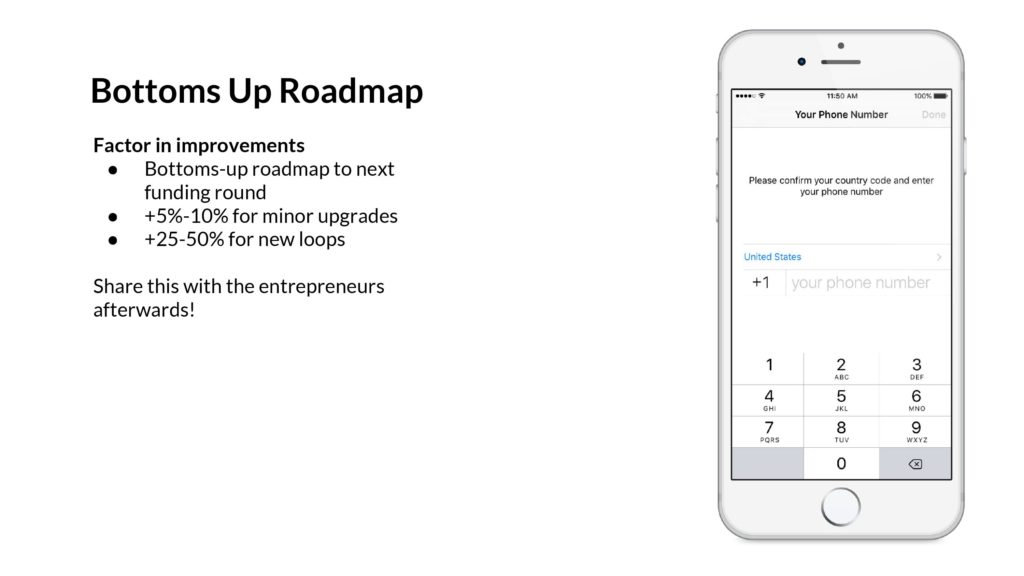
Above: Using our understanding of the potential product improvements, we ought to be able to create a bottoms up roadmap of all the improvements. We can use our expertise to understand when changes might be a +5% and when they might be a +20%. Combine all of it together, and you get a picture of the upside.
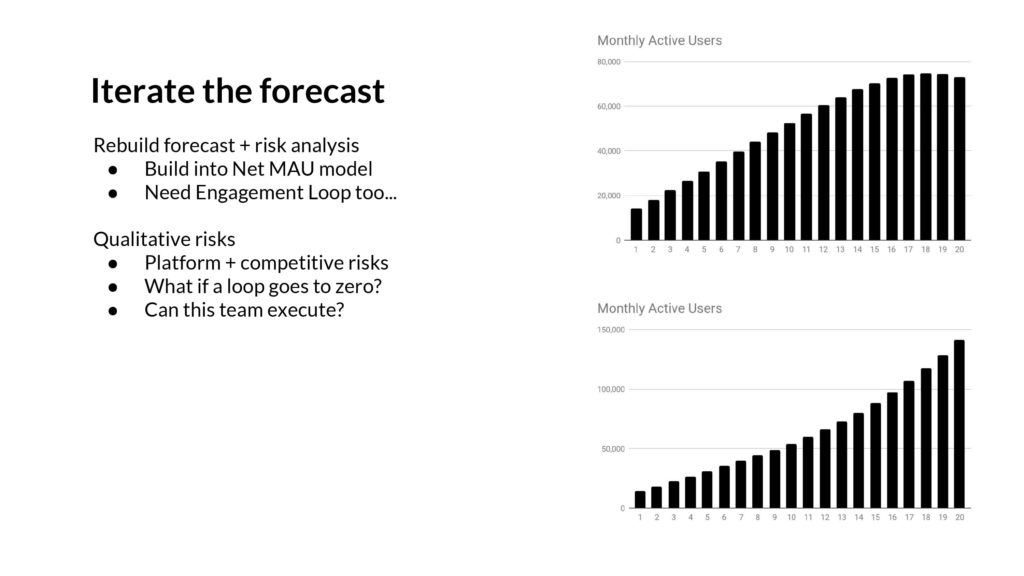
Once you have all of this together, then you ought to be able to create a series of scenarios on where your growth curves are going to go. Perhaps you can assume the product and marketing teams execute aggressively, and capture all the upside you saw. Or perhaps you can assume there’s no engineering help, and it’s just a matter of adding a few new advertising channels. All of these scenarios can be combined to create a new curve. This is your forecast. It’s a prediction of the future.
If you did all of this, you’d still have a major problem. Your prediction would suck, because you only looked at one half of the problem. The other side is Engagement, and all the loops there.
There’s an Engagement Loop, similar to what we looked at with the Acquisition Loop. Let’s take a look there.
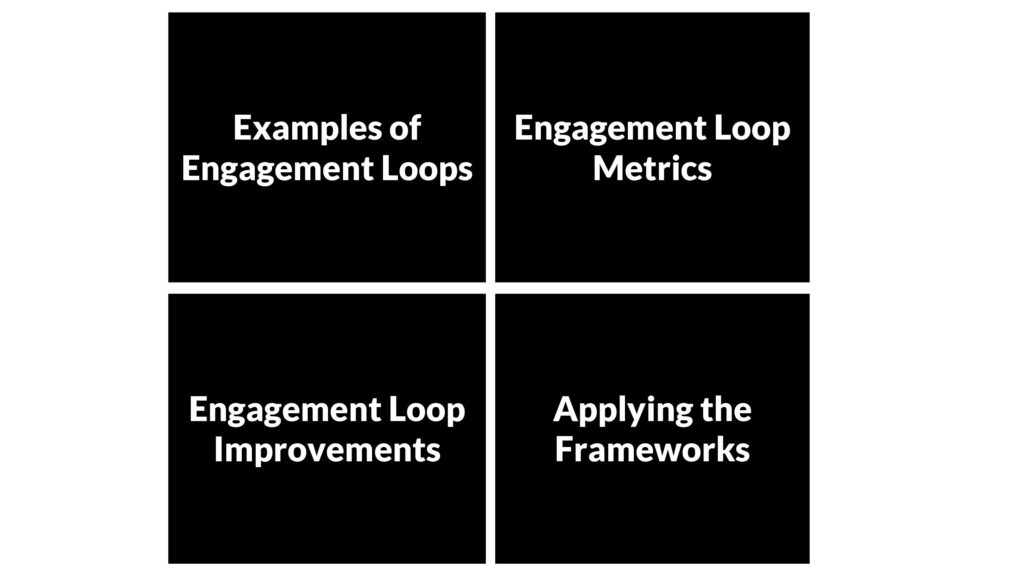
Above: We’ll go through the same format. First examples, then how to improve, then how to measure, and then let’s bring it together and apply it.
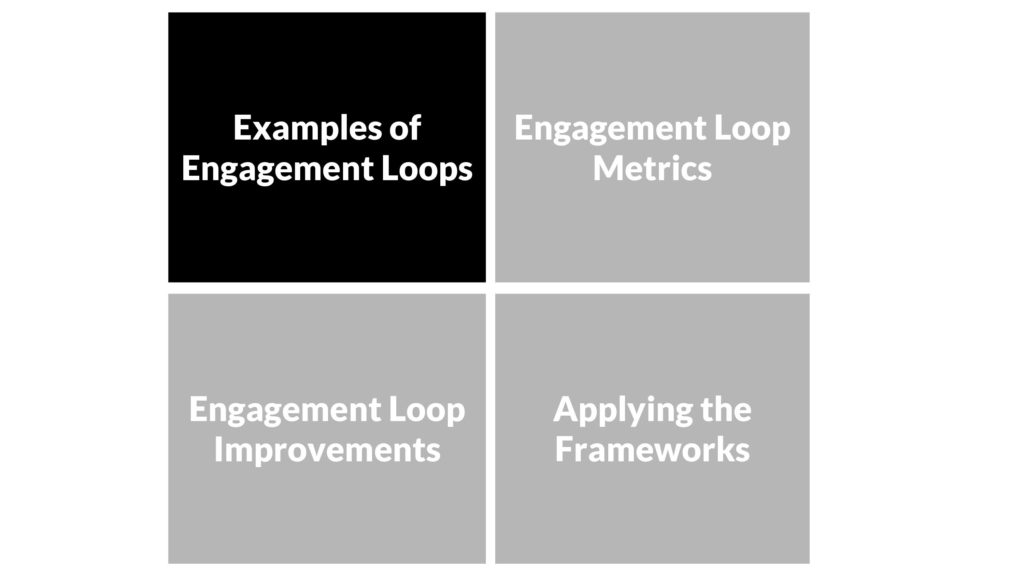
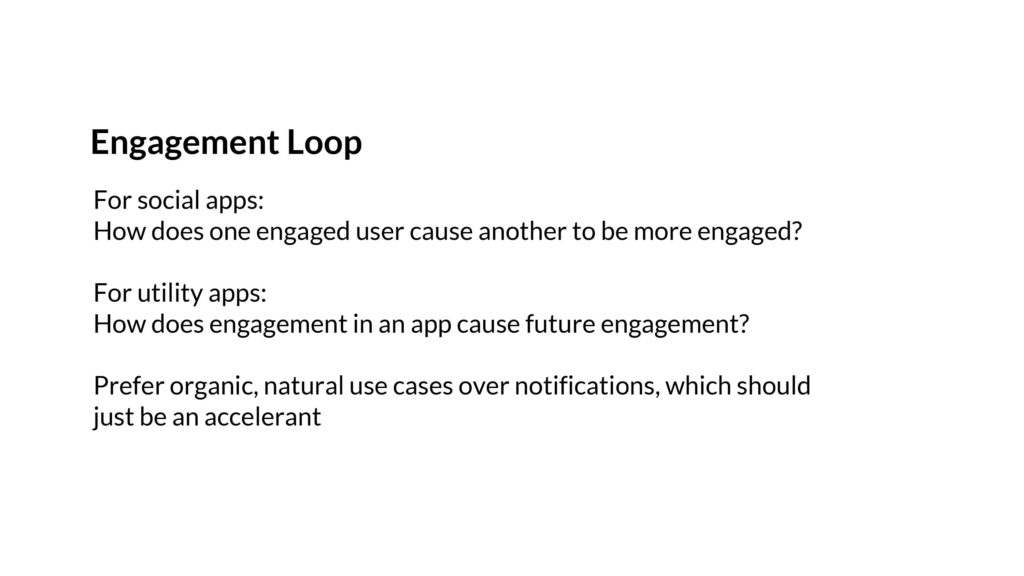
Above: The key question with engagement is similar to the one we asked on acquisition. If you have a network-based product, like Dropbox or Slack, then you need active users to engage each other. If it’s purely a utility, then you want engagement in one time period to help set up engagement in a future time period.
Let’s run through some examples.

In an engagement loop that’s based on social feedback, you get a game of ping pong. One user messages/follows/mentions another, and they draw them back. And then that user might do the same, and draw in a different user. And this repeats. This is why achieving network density and easy content creation is so important- you need ways to bring people back into the network.

On the other hand, there are engagement loops that are more like planting seeds. If you sign up for Zillow and put in your home address, and favorite a couple new real estate listings, then Zillow will start re-engaging you with personalized emails. Sometimes it’ll be when your house goes up in value, other times it’ll be when new listings show up in your neighborhoods. Credit Karma is the same, where a single setup session leads to important notifications about credit score changes over time.
These are just two engagement loops, and there are many more.
Another fun one is rideshare, where seeing physical on-the-street reminders of the product might prompt you to use it too. Mapping works in a similar way, often starting with a real-life trigger of “I’m lost!”
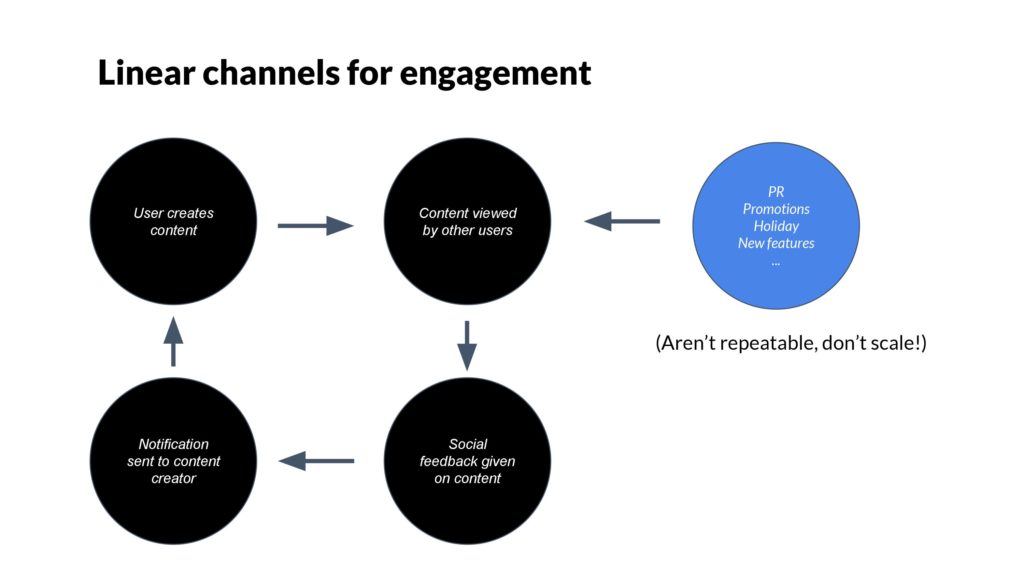
Just like the acquisition loop, there are linear channels to re-engage users. These are useful, of course, but again, they don’t scale. It’s better when users re-engage each other or when users re-engage themselves.
This is part of why marketing-driven one-off email campaigns are often ineffective. They don’t scale, aren’t interesting to users, and with enough volume, can cause folks to churn. Not good.
It’s much better to see a natural engagement loop that leverages push notifications and email in a way that’s user-initiated.
In the same way we analyzed acquisition loops to understand upside, we can do so for engagement loops.
The first step is to break down the loop into much smaller, more granular steps.
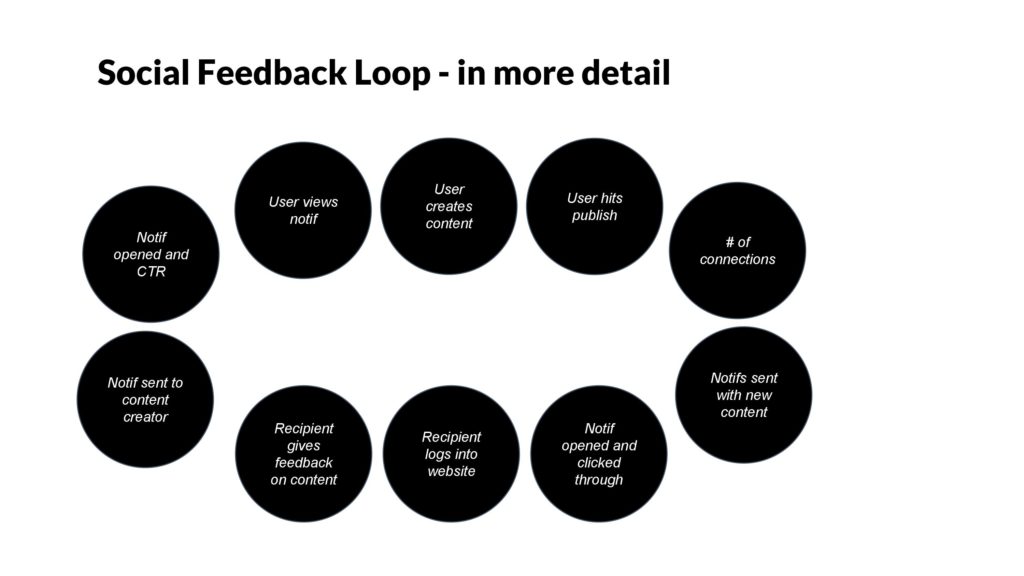
Above: Here, we’ve taken a Social Feedback loop that starts with a user creating content and publishing, to their friends viewing, adding comments, and then the notification back to the original user.
Now let’s zoom in on a particular step.
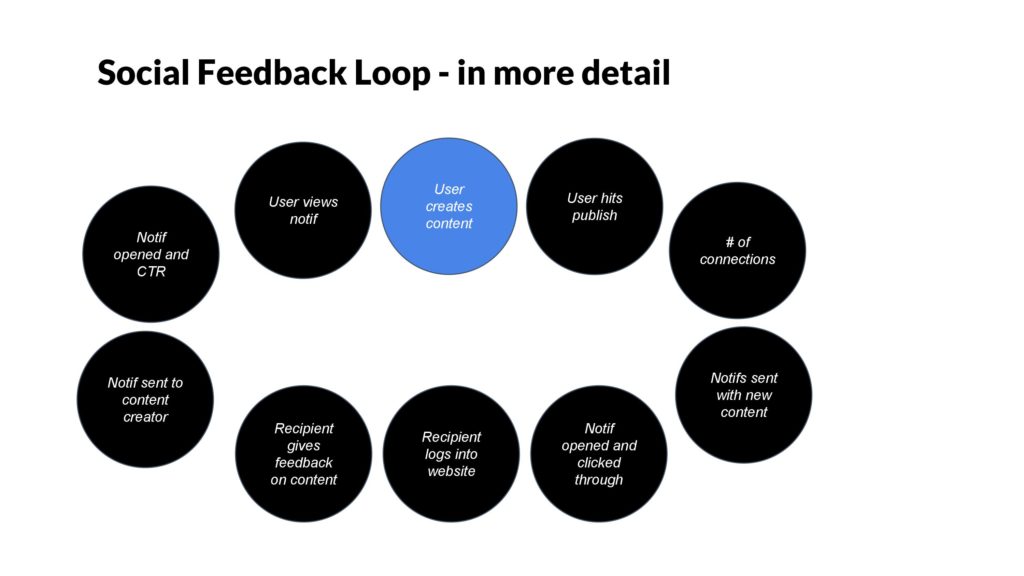
Above: The social feedback loop fundamentally is built on the content creation step. If it’s not easy, then it won’t work. So it has to be an activity that a lot of users want to do. That’s why taking a photo, typing in a text, or hitting a heart are all so effective. They’re dead simple actions.
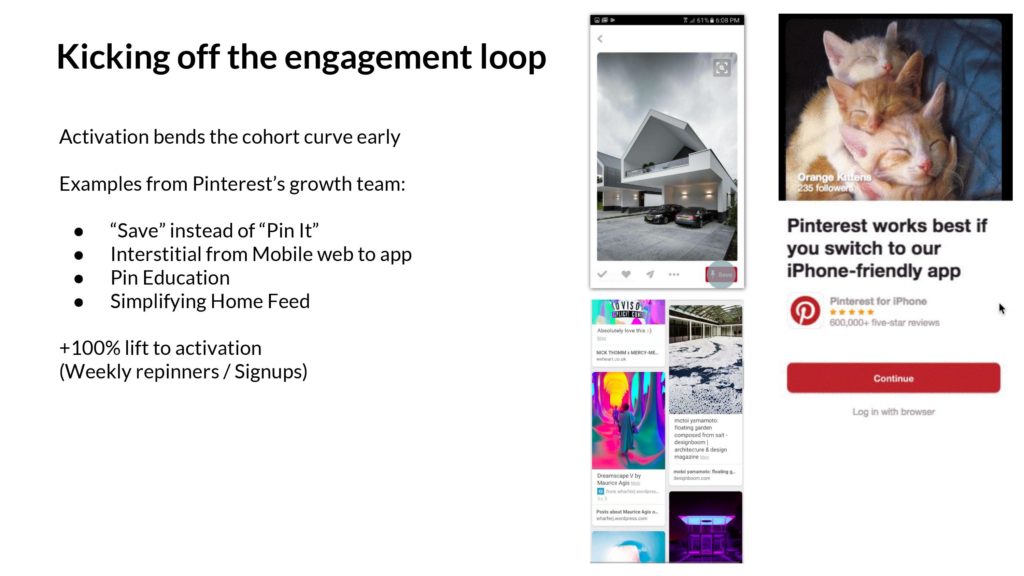
Above: Pinterest has many examples where they’ve optimized content creation – or more specifically, more pinning/repinning per new signed up user. One method is to use the term “Save” as opposed to the more wonky term “Pin it.” Another is to up-sell the mobile app where it’s easy to interact. Education during onboarding helps too. All of these changes doubled the activation rate for new users, causing them to repin more, kicking off engagement loops for themselves and other users.
Once you create content, then you need to circulate it within your network.
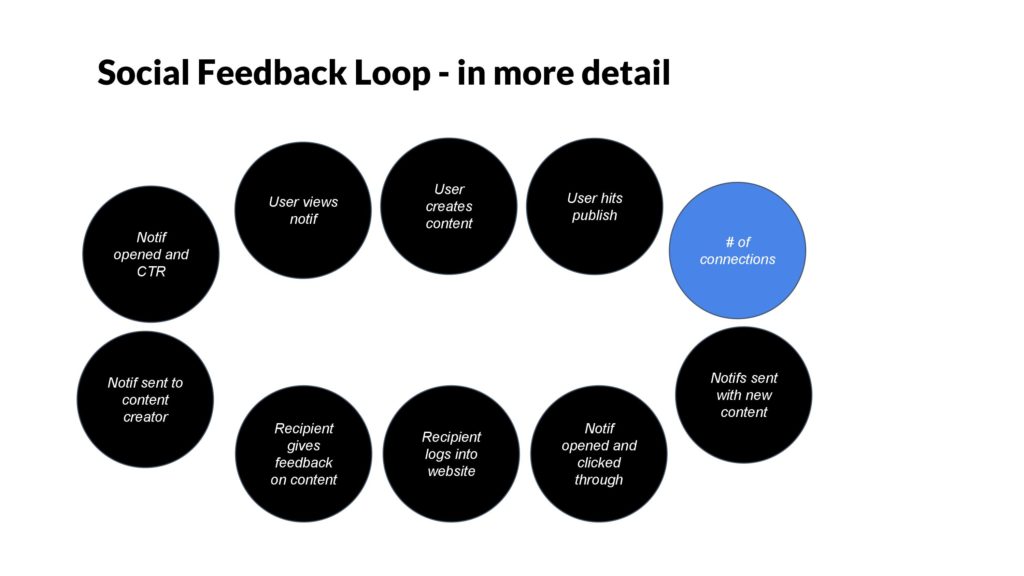
One key aspect of every network is the density of connections. It’s important to build the number of connections up, but they have to be relevant. And there’s diminishing returns too.
A decade+ into the social platform paradigm, there’s now a playbook for how to do this. Let’s cover some of these ideas.
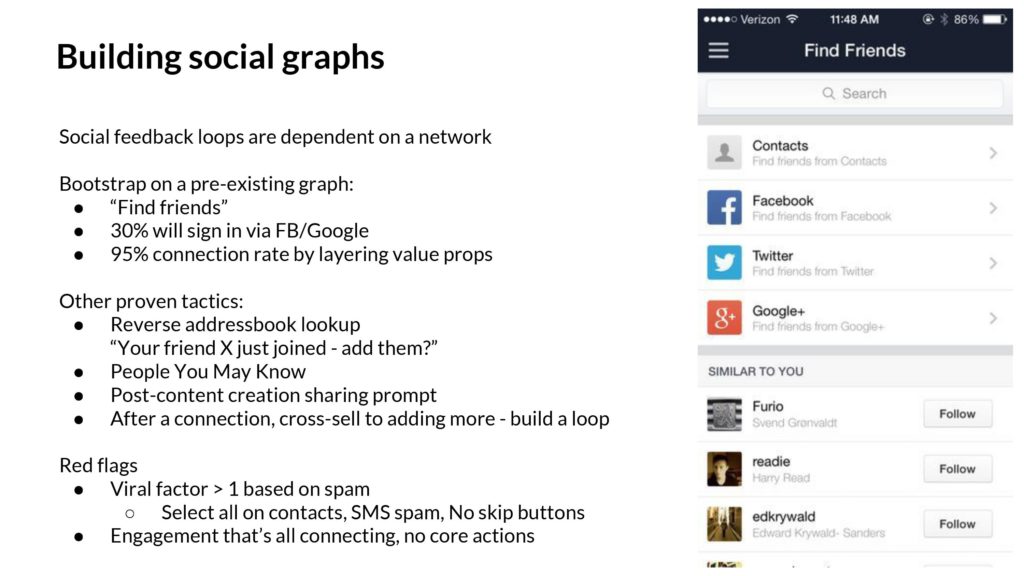
Above: An important way to build a social graph is to bootstrap on an existing network. For consumer products, that might be your phone’s addressbook or Facebook. Within the enterprise, it might be your colleagues’ emails in ActiveDirectory or GSuite or your work email. There’s tactics like asking people to “Find Friends” and to build “People You May Know” features to increase density.
The red flags here are folks who claim to have explosive viral growth just based on inviting. It won’t last, and they’ll be low quality signups. Similarly, if the core activity is all inviting and friending and there’s no main activity, that’s not good either. Better to let those ones go.

As a final examination of looking for upside in user engagement, it’s important think about an otherwise innocuous step- your users clicking on a notification, trying to get back into your product, but perhaps they’ve logged out.
How bad can it be to get logged out?
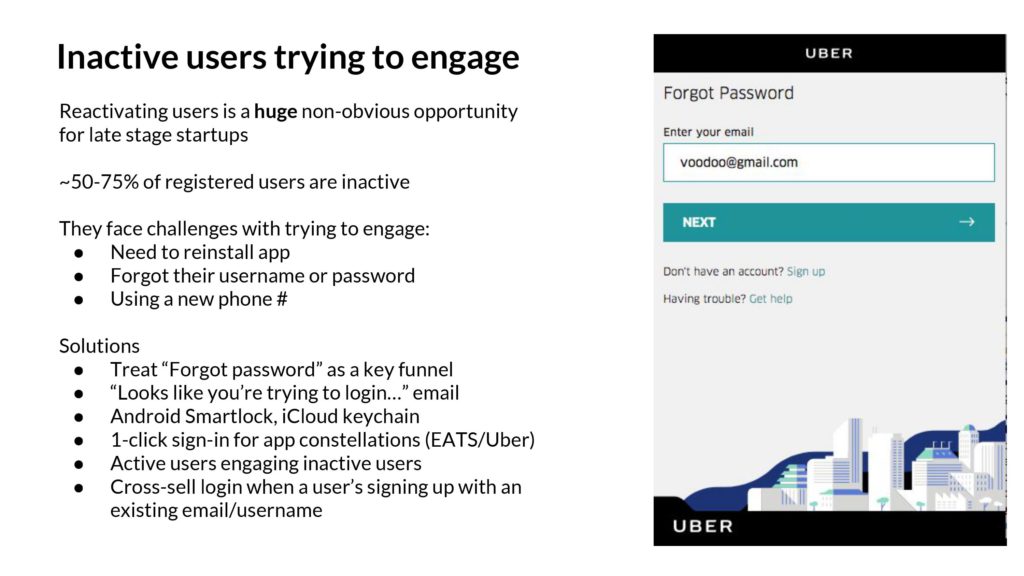
Turns out, being logged out and failing your password attempts can become a huge drag for established products with large audiences. It’s common for 50-75% of signed up users to actually be inactive – that is, the majority of your users will have tried the product but never get hooked.
The problem is when those inactive users come back, perhaps because of a notification or some other reason, and try to log back in. They often are locked, can’t remember their password, and become permanently inactive. Not great. The solution is manifold – first to treat this flow seriously, with KPIs and optimizations. There’s tactical things, like integrating into iCloud keychain, logging in with other apps if you have a multi-app strategy, and so on.
A company like Uber might literally see tens of millions of failed sign in attempts. Amazing. And perhaps a good percentage of those riders are trying to log back in, standing at an airport wanting to take a trip, and eventually, in frustration, they walk across the street and grab a cab. It’s worth fixing.
Now that we have the conceptual idea of an engagement loop set, and understand potential upsides, let’s dig into the metrics. What should we look for?
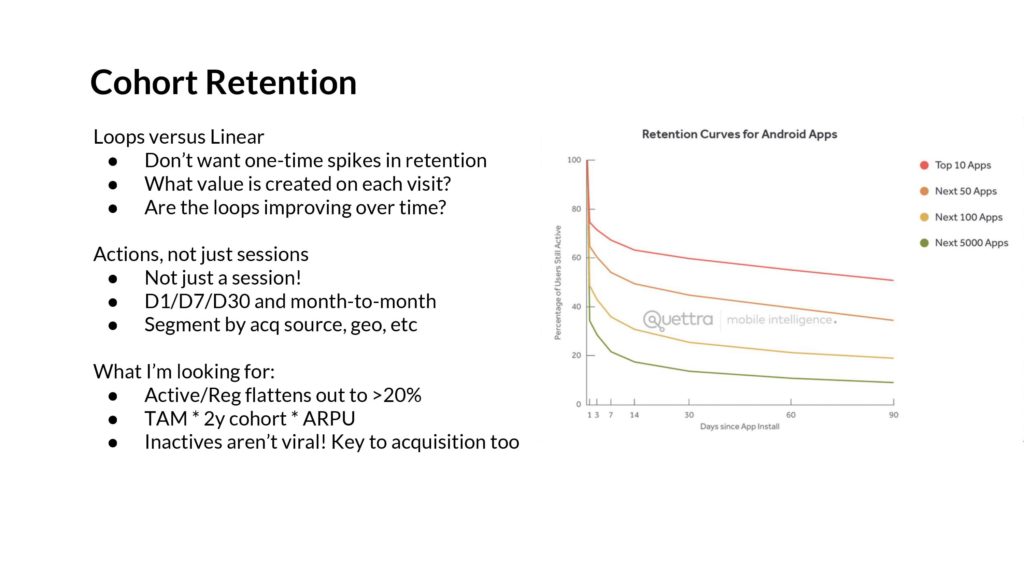
Above: The first, as everyone knows, is to look at everything in cohorts. We want to understand conceptually why the user cohorts are being brought back – is there value being created at each visit that makes the product more sticky over time? Are they building a network? We want to understand the classic D1/D7/D30 metrics – for which there are many comps – and also look at the month to month numbers.
There are a couple key things to watch for: The cohort curves need to flatten. Ideally >20%, so that each signup activates into a sticky, active user over time. If only 5% of users stick, then you’d have to sign up 2B users to get 100M MAUs. Not tenable.
You can project out the total size of the company with this, by combining TAM with the cohort % you have left after a year (D365 or D730) and then the ARPU. This needs to be big enough to have venture scale.
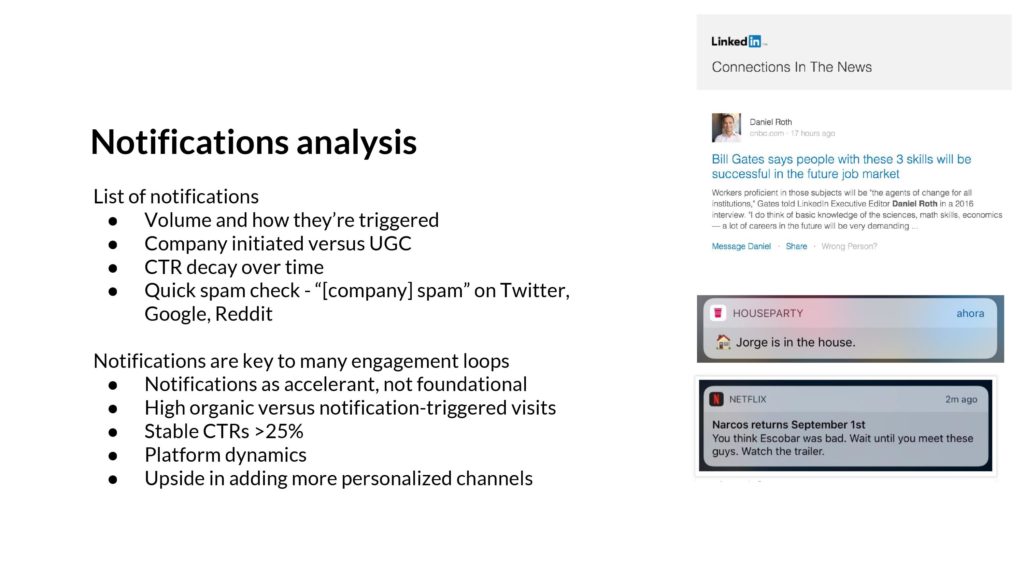
Above: One of the key tools for the engagement loop is the use of notifications – whether that’s email, push notifications, or some other on-platform channel. They are easy to be abused.
To detect artificial engagement that’s being manufactured, not organically created by users, you can look at a breakdown of every notification that a product sends out. And the volume and CTRs over time. You should do a quick spam check on Reddit, Twitter, Google, and other places.
Ultimately, the right attitude towards notifications is that they accelerate engagement that’s already there – you can’t make it out of thin air. Some products naturally generate a lot of notifications, and others don’t. Some are higher CTR than others.
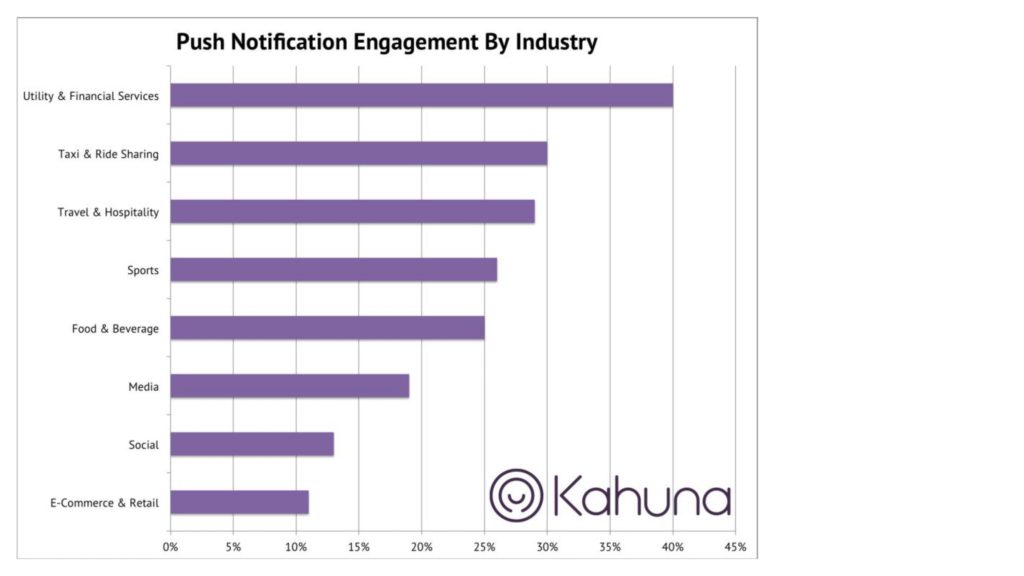
Above: This is one push notification chart I’ve used in the past. Ecommerce companies often use push to advertise sales- no wonder the CTRs are low. But if you are looking at ridesharing, you’ll probably interact with the push because you want to make sure your car is here!

Another set of metrics we want to understand on user engagement is frequency of use. Almost every product I’ve seen has a “ladder of engagement” where you come for one use case, but ultimately become stickier and higher frequency by adding use cases.
For Uber, riders would often do their first trip because of travel use cases, like getting to the airport – this is a 2 trips/year activity. Then they’d layer on “going out” – like dinners on the weekend, which might be 1 trip/week. And eventually a number of other use cases until they got to commuting, which could be 2 trips/day.
What I want to understand with a Frequency diagram is to segment high- and low- frequency segments, and start digging into their usage of the product. If you can upsell new use cases, then there’s a ton of upside.
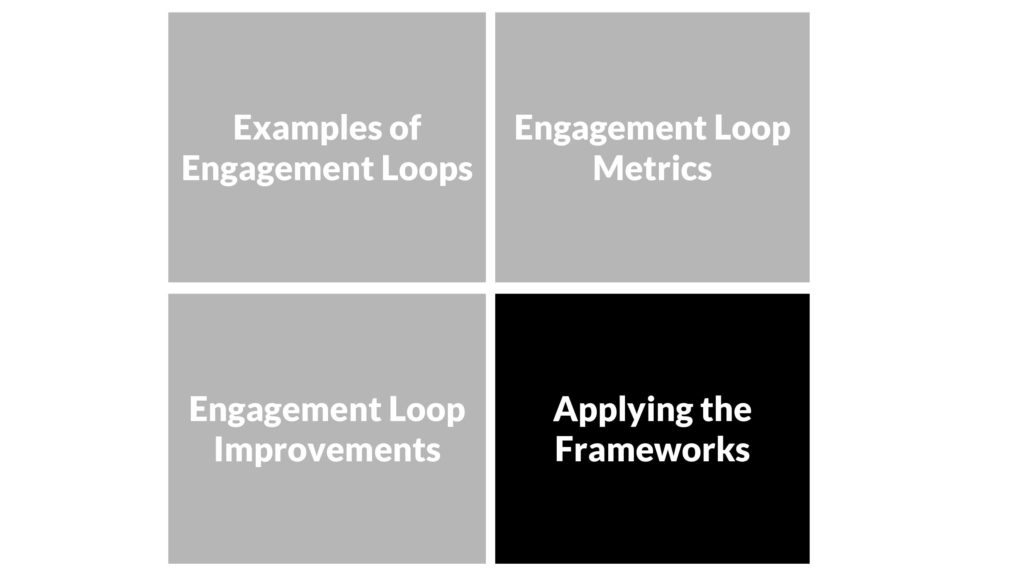
Now that we have all the tools, we can build the forecast.

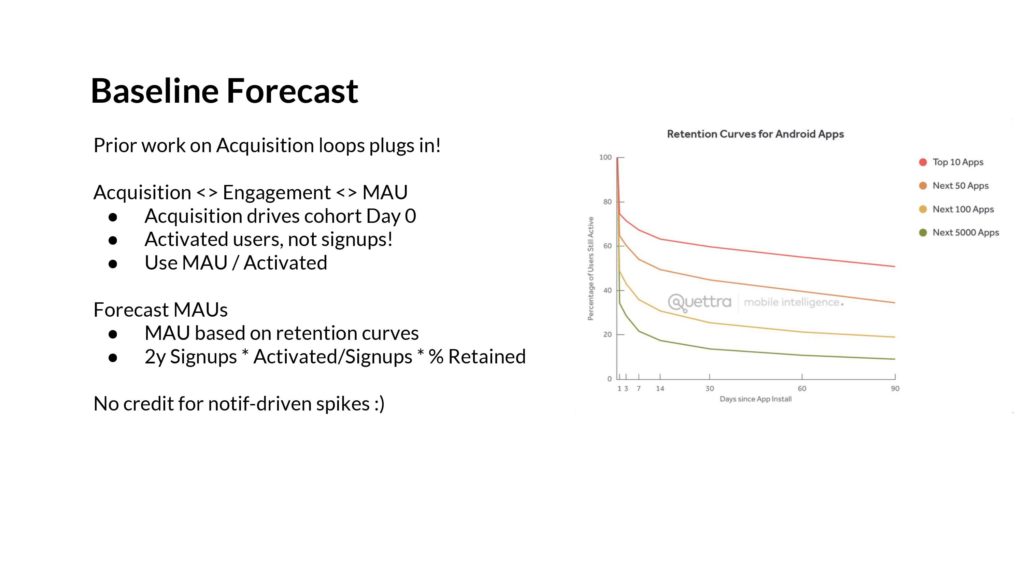
The prior forecast on the acquisition loops can plug into this, because each cohort starts with the number of new users who have been acquired. We can then use the cohort retention curves to build curves that translate to monthly actives or customers.
We can forecast MAUs once we have both the acquisition and engagement curves. Project that out a few quarters, and you can get a fine-grained understanding of where MAUs will be in 2 years.

Engagement metrics are very hard to move compared to Acquisition. As a result, it’s better to assume the curves are what they are. But if you must add a bullish forecast, the right way to go is to focus on new user activation. And up-selling users from one frequency segment into the other. That’s the quantitative way to do it.
And so there we have it!
We have the engagement loop, and the acquisition. We have forecasts for each. We have upside scenarios.
So what can we do with this?
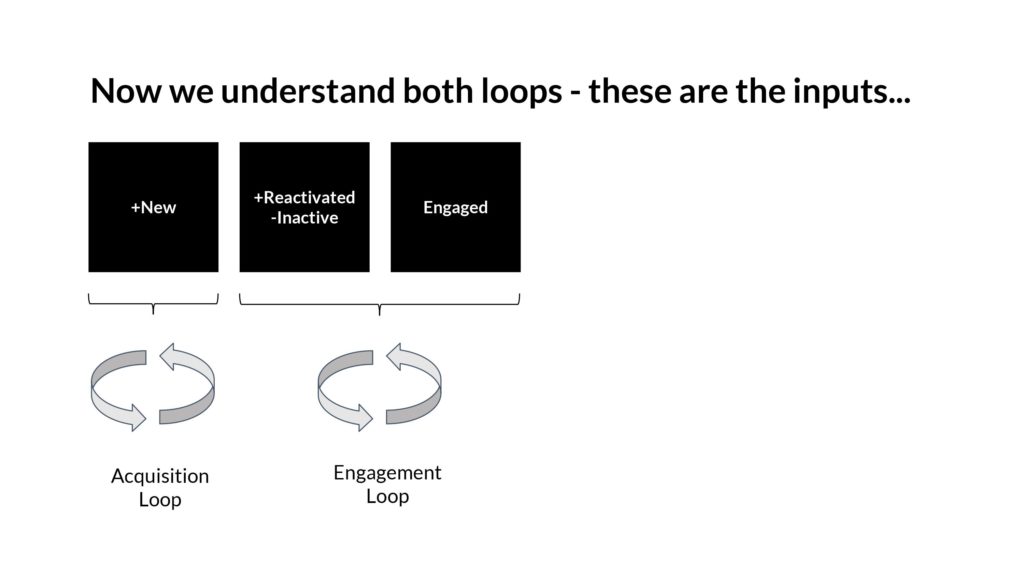
This whole discussion started with the Growth Accounting Framework. If we have a deep understanding of both acquisition and engagement, then we have the inputs.
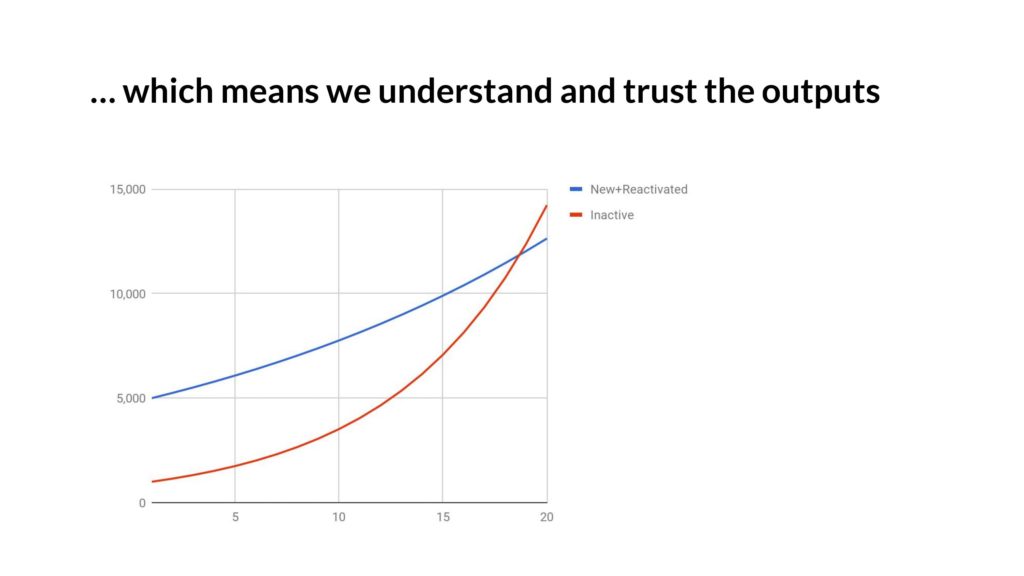
With the inputs, we can build scenarios that model the outputs.
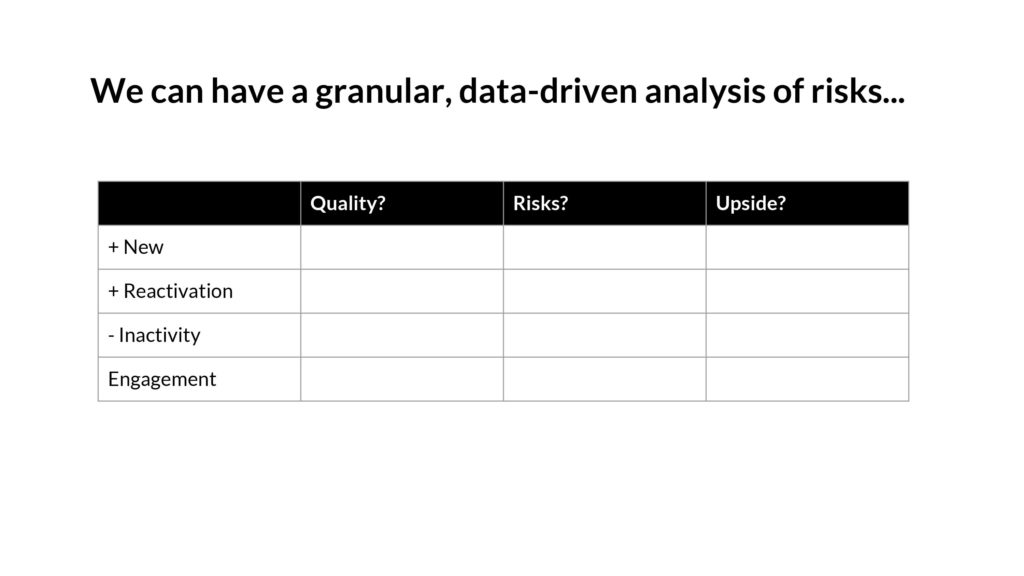
We can get a granular sense of the risks involved. Ultimately this is about a forecast that’s about the quality of acquisition, and the quality of engagement, not a single number in 2 years.
Startups aren’t spreadsheets.
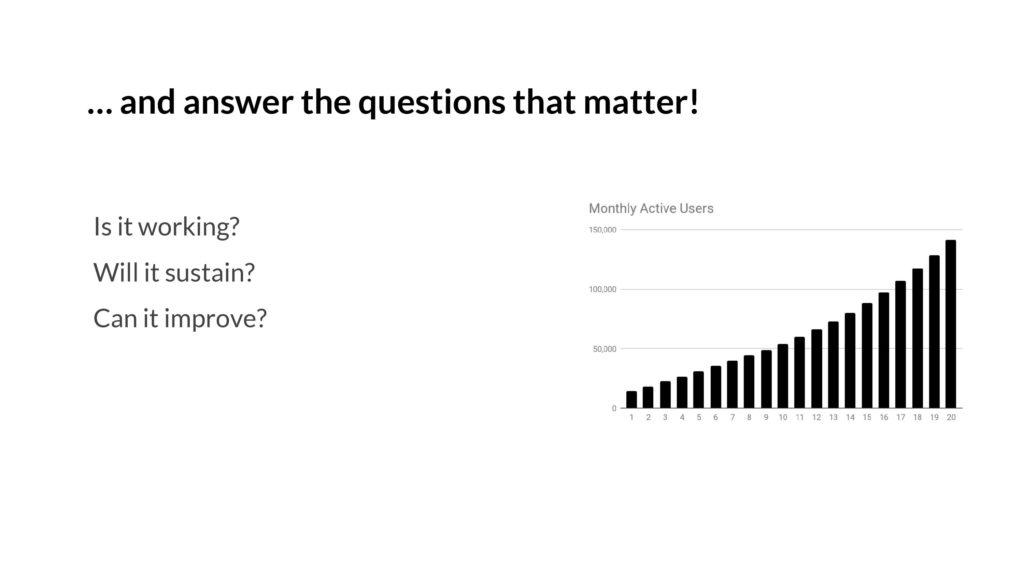
With all of this, we can answer the questions that matter. If a startup walks in the door, and shows a graph, we can have a real discussion of what might happen next.
OK, and that was it. (I chopped off a couple slides off the end since it’s more self-promotion – you got the meat of it!)
The epilogue
One month after I presented this deck, I got the offer to join a16z! So it worked. 10 years in the bay area, dozens of angel investments, 6 months of interviewing, culminating in my new role.
For all of you read this far – thank you! Hope you enjoyed this deck and essay. If you have feedback, shoot me a tweet: @andrewchen.
Thank you
Also, special shoutout to Brian Balfour, Shaun Clowes, Casey Winters, Bubba Murarka, and Aatif Awan who helped me at various points in iterating the content here. Couldn’t have done it without you guys! Appreciate your help on this.