Archive for February, 2016
Growth is a system, not a bag of tricks – Manifesto Conference Q&A video/transcript
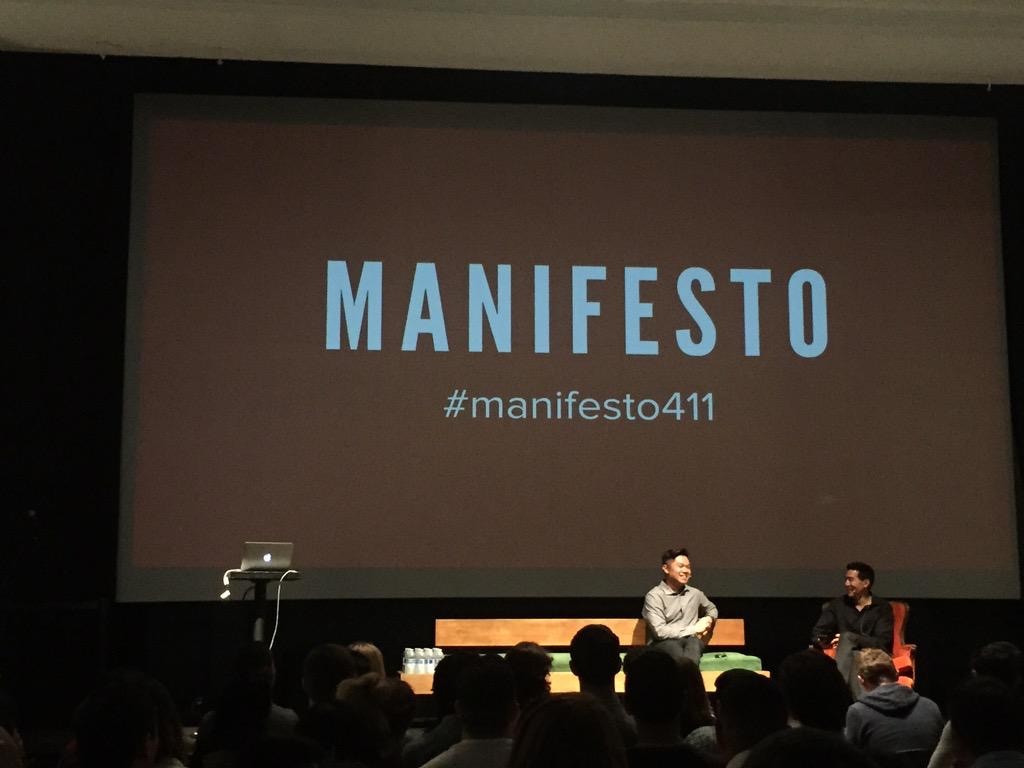

I recently was interviewed by Tim Chang, Managing Director of the Mayfield Fund at the Manifesto conference. We talked about growth, what I has learned from trying different tactics, and how to evaluate the success of growth initiatives. (By the way, SC Moatti, the co-producer of Manifesto, also a tech entrepreneur and ex-Facebook PM, is writing a book on the business mobile called Mobilized. I had a chance to read it and find her insights really valuable. And the next Manifesto is dedicated to mobile.)
You can watch the full video of my talk here.
Here’s the key points of the Q&A below. (Thanks to David Grotting for helping with these)
How Did You Get Started?
- Started in Venture Capital as an entrepreneur in residence at Mohr Davidow Ventures.
- One of my most important experiences was working in Ad Tech
- You spend all of your time thinking about quantitative customer acquisition for tens of thousands of customers.
- You learn all the interesting nuances of different business models and gain a keen sense of customer funnel optimization and key metrics like cost per customer and LTV.
- One example being working with a dating site and realizing that the average time for a dating “match” was about 4 months so it’s important to get users to sign up for a 12 month subscription. This is very different than a gaming company strategy, as a contrast.
- I was one of the few people who had all this quantitative experience with customer acquisition and wanted to apply it in a consumer context.
- At this time in ‘07 the IQ around consumer products was was relatively low – and investors were making investments off number of hundreds of thousands of registered users. It’s been amazing to see over the the last couple years how much the industry has upgraded its thinking.
Lessons To Share About Growth:
- Growth is not a bunch of small, tactical growth hacks. (Make a button this color, etc.)
- Growth is a full model and system with linked parts and loops that align with your business
- Tactics can be used to optimize loops, but the entire model must be well understood first.
- If you’re going to focus on virality – it’s not about just building something cool, but actually thinking how one batch of users end up inviting the next batch of users and optimizing that entire loop with with tactics.
- You must put in the hard work to build a framework that is situationally right for your product.
What is a Growth Hacker?
- Sean Ellis coined the term while working with Sequoia companies. It was the embodiment of a direct response marketer combined with a product manager that had a deep focus on analytics.
- Growth is fundamentally a product thing: Requires true team effort of PMs, designers, developers, etc. that utilize software to drive KPIs
- Growth Hacking has started to become a negative signal: Next generation of consultant keyword/title
Metrics should be a reflection of the strategy you’ve decided
- Be careful about focusing on vanity metrics like daily installs
- Churn is one of the most defining aspects of whether or not you have a sustainable business.
- Have your metrics prove that you are creating a sustainable growth model
- In the beginning, entrepreneurs build a product from the heart and have the ability to be hyperattentive, listen to each customer, and get all the details right. You then get to a point where there is a phase transition where you have to truly scale, and that tends to be the most difficult.
- Finding product/market fit is key before scaling growth efforts
- Mobile is in a dark time and it is very difficult to grow a mobile app now. It is daunting for new startups as successful apps are prioritized in rankings and it becomes more difficult to gain new-app visibility. You must continue to look for new platforms.
Messaging apps are going to create the next platform beyond app stores
- Messaging is where social was in ‘07/’08
- Just like adding social to other categories of products has been successful (Social Reviews = Yelp, Social Videos = YouTube, etc.), messaging will have opportunities to be paired with other categories of products with success.
- Messaging and communication is the killer app for your phone.
- I’m hopeful that messaging will create the next generation platform for mobile app distribution.
- Working backwards when you have a new idea or new product and thinking about how it relates to messaging is a very important question to ask if you want to be hitting scale 2-3 years from now.
Who are your influencers and what are some of your favorite books?
- Book: My Life in Advertising
- Stratechery: Ben Thompson
- Ben Evans at a16z
- Book: Designing Interactions
- More tech books
A Practitioner’s Guide to Net Promoter Score
[Dear readers, this essay is about the practical aspects of measuring Net Promoter Score, an important metric that often correlates strongly with word-of-mouth virality. Sachin Rekhi, the author, has a blog and can be found on Twitter at @sachinrekhi. He’s was most recently Director of Product at Linkedin, leading the Sales Navigator product, and previously, an Entrepreneur-in-Residence at Trinity Ventures. Most importantly, Sachin married my sister Ada after meeting her in college at UPenn :) -Andrew]
Sachin Rekhi (ex-LinkedIn):
A Practitioner’s Guide to Net Promoter Score
Over the past year at LinkedIn I developed a strong appreciation for using Net Promoter Score (NPS) as a key performance indicator (KPI) to understand customer loyalty. In addition to the standard repertoire of acquisition, engagement, and monetization KPIs, NPS has become a great additional measure for understanding customer loyalty and ultimately an actionable metric for enhancing your product experience to deliver delight.
I wanted to share the best practices I’ve learned for implementing an NPS program within an organization to get the most out of this KPI for driving more delightful product experiences.
The Origin of NPS
Net Promoter Score (NPS) is a measure of your customer’s loyalty, devised by Fred Reichheld at Bain & Company in 2003. He introduced it in a seminal HBR article entitled The One Number You Need to Grow, which I highly recommend anyone serious about NPS to read in detail. Fred found NPS to be a strong alternative to long customer satisfaction surveys as it was such a simple single question to administer and was able to show correlation between NPS and long-term company growth.
How NPS is Calculated
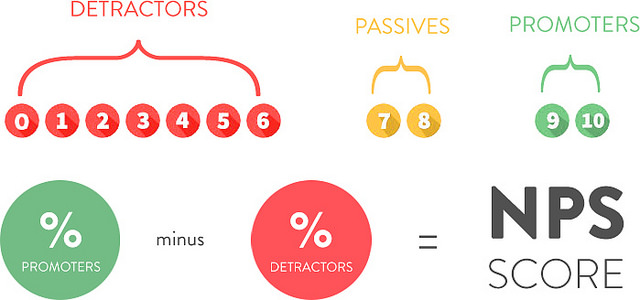
NPS is calculated by surveying your customers and asking them a very simple question: “How likely is it that you would recommend our company to a friend or colleague?” Based on their responses on a 0 – 10 scale, group your customers into Promoters (9-10 score), Passives (7-8 score), and Detractors (0-6 score). Then subtract the percentage of detractors from the percentage of promoters and you have your NPS score. The score ranges from -100 (all detractors) to +100 (all promoters). An NPS score that is greater than 0 is considered good and a score of +50 is excellent.
Additional NPS Questions
In addition to asking the likelihood to recommend, it’s essential to also ask the open-ended question: “Why did you give our company a rating of [customer’s score]?” This is critical because it’s what turns the score from simply a past performance measure to an actionable metric to improve future performance.
It’s also helpful to ask how likely they are to recommend your competitor products or alternatives, so you can establish a benchmark for how your NPS score compares to others in your industry as there are substantial differences in scores by product category. Keep in mind though that these results are biased since you are sampling your own customers for these benchmarks instead of a random cross-section of potential customers, including those who have chosen competitive solutions.
Many ask additional questions to understand additional drivers of the customer’s score. These are optional as while they add value in understanding the results, they add complexity which reduces the response rate, so you need to consider the trade-off of doing so.
Collection Methods
NPS scores for online products are typically collected by sending the survey via email to your customers or through an in-product prompt to answer the survey. To maximize response rates, it’s important to offer the survey across both your desktop & mobile experiences. While you could create such a collection tool in-house, I encourage folks to use one of the NPS survey solutions out there that support collection and analysis across a variety of channels and interfaces, such as one offered by my wife Ada’s employer SurveyMonkey.
One challenge with both email and in-product based survey methodologies is they tend to bias responses to more engaged customers as less engaged users are likely not coming back to the product nor answering your company’s emails as frequently. We’ll talk about potentially addressing this below.
Sample Selection
It’s important to survey a random representative sample of your customers each NPS survey. While that may sound easy, we found cases in which the responses weren’t in fact random and it became important to control for this in sampling or analysis. For example, we found strong correlation between engagement and NPS results. Therefore it was important to ensure your sample in fact reflects the engagement levels of your actual overall user base. Similarly, we found a correlation between customer tenure and NPS results as well, thus another key factor to ensure the customer tenure in the sample similarly matches that of your overall user base.
Survey Frequency
When thinking about how frequently to administer an NPS survey, there are several key considerations. The first is the size of your customer base. The smaller your customer base, the larger sample you need to survey each time or even wait longer for more responses to achieve a higher response rate, which limits how frequently you can administer future surveys. The second consideration is associated with your product development cycle. Product enhancements end up being one way to drive increases in scores and therefore the frequency of score changes depends on how quickly you are iterating on your product to drive such increases. NPS tends to be a lagging indicator so it takes time even after you’ve implemented changes to the customer’s experience for them to internalize the changes and then reflect such changes in their scores. On my team at LinkedIn we found it best to administer our NPS survey quarterly, which aligned with our quarterly product planning cycle. This enabled us to have the most recent scores before going into quarterly planning and enabled us to react to any meaningful observations from the survey in our upcoming roadmap.
Analysis Team
If your goal is to use NPS to drive more delightful product experiences, it’s important that you have all the key stakeholders involved in product development as part of the NPS analysis team. Without this, the NPS survey rarely get’s used as a meaningful part of the product development lifecycle. For us at LinkedIn, this meant including product managers, product marketing, market research, and business operations in the core NPS team. We also broadly share the findings with the entire R&D team each quarter. While it will certainly depend on your own development process, it’s critical to ensure the right stakeholders are involved right from the beginning.
Verbatim Analysis
The most actionable part of the NPS survey is the categorization of the open-ended verbatim comments from promoters & detractors. Each survey we would analyze the promoter comments and categorize each comment into primary promoter benefit categories as well as similarly categorize each detractor comment into primary detractor issue categories. The categories were initially deduced by reading every single comment and coming up with the large themes across them. We conducted this analysis every quarter so we could see quarter-over-quarter trends in the results. This categorization became the basis of how we came up with roadmap suggestions to address detractor pain points and improve their overall experience. While it can be daunting to read every comment, there is no substitute for the product team digging in and really listening directly to the voice of the customer and how they articulate their experience with your product.
Promoter Drivers
While oftentimes folks spend a lot of time looking at NPS detractors and how to address their concerns, we found it equally helpful to spend time on promoters and understanding what was different about their experiences to make them successful. We correlated specific behavior within the product to NPS results (logins, searches, profile views, and more) and found a strong correlation between certain product actions and a higher NPS. This can help deduce what your product’s “magic moment” is when your users are truly activated and likely to derive delight from your product. Then you can focus on product optimizations to get more of your customer base to this point. The best way to get to these correlations is simply to look at every major action in your product and see if there are any clear correlations with NPS scores. It’s easy to just graph and see if this is the case.
Methodology Sensitivities
We found NPS to be sensitive to methodology changes in the questions being asked. So it’s incredibly important to be as consistent in your methodology across surveys. Only with a fully consistent methodology can you consider results comparable across surveys. The ordering of the questions matters. The list of competitors that you include in the survey matters. The sampling approach matters. Change the methodology as infrequently as possible.
Seasonality
We found that there may be some seasonality at play in certain quarters that effect NPS results, correlating with engagement seasonality. We’ve heard that this is even truer for other businesses. So it may end up being more important to compare year-over-year changes as opposed to quarter-over-quarter changes to ensure the effects of seasonality are minimized. While this may not be possible, it’s at least important to realize how this could be effecting your scores.
Limitations of NPS
While NPS is an effective measure for understanding customer loyalty and developing concrete action plans to drive it up, it does have it’s limitations that are important to understand:
1. The infrequency of NPS results make it a poor operational metric for running your day-to-day business. Continue to leverage your existing acquisition, engagement, and monetization dashboards for tracking regular performance as well as for conducting A/B tests and other optimizations.
2. Margin of error with the NPS results depend on your sample size. It can often be prohibitive to get large enough of a sample to significantly reduce the margin of error. So it’s important to be aware of this and not sweat small changes in NPS results between surveys. More classic measures like engagement that don’t require sampling have a far lower margin of error.
3. NPS analysis is not a replacement for product strategy. It’s simply a tool for understanding how your customers are perceiving your execution against your product strategy as well as provides concrete optimizations you can make to better achieve your already defined strategy.
[This essay was first published here. Sachin Rekhi, the author, has a blog and can be found on Twitter at @sachinrekhi. He’s was most recently Director of Product at Linkedin, leading the Sales Navigator product, and previously, an Entrepreneur-in-Residence at Trinity Ventures. ]