Archive for January, 2016
Uber’s virtuous cycle. Geographic density, hyperlocal marketplaces, and why drivers are key
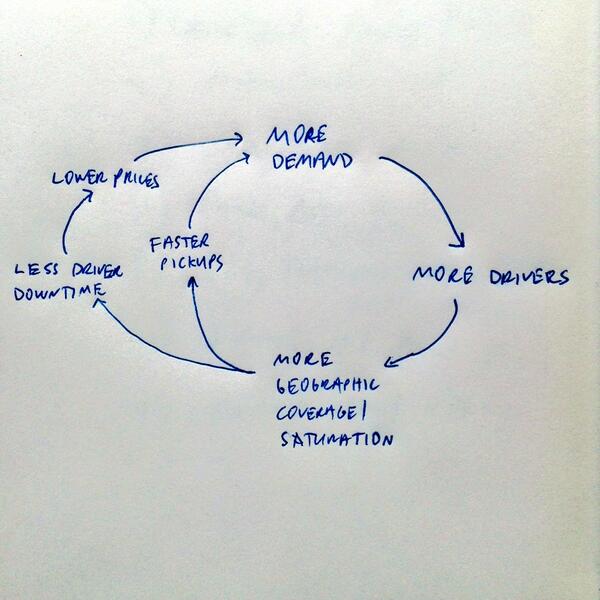
Uber’s virtuous cycle
Back in 2014, David Sacks (ex-Paypal, Yammer, Zenefits) tweeted the above diagram to explain why Uber’s geographic density is the new network effect. It’s an insightful diagram that’s been built upon by Bill Gurley (Benchmark Capital and on Uber’s board) in his essay How to Miss By a Mile: An Alternative Look at Uber’s Potential Market Size.
Bill Gurley sums up Uber’s network effect as three major drivers:
- Pick-up times. As Uber expands in a market, and as demand and supply both grow, pickup times fall. Residents of San Francisco have seen this play out over many years. Shorter pickup times mean more reliability and more potential use cases. The more people that use Uber, the shorter the pick up times in each region.
- Coverage Density. As Uber grows in a city, the outer geographic range of supplier liquidity increases and increases. Once again, Uber started in San Francisco proper. Today there is coverage from South San Jose all the way up to Napa. The more people that use Uber, the greater the coverage.
- Utilization. As Uber grows in any given city, utilization increases. Basically, the time that a driver has a paying ride per hour is constantly rising. This is simply a math problem – more demand and more supply make the economical traveling-salesman type problem easier to solve. Uber then uses the increased utilization to lower rates – which results in lower prices which once again leads to more use cases. The more people that use Uber, the lower the overall price will be for the consumer.
Ben Thompson says it differently, with a competitive lens, in his essay Why Uber Fights, which is also a great compliment to Gurley’s piece.
The point to the above articles is super interesting. From a UX experience, Uber is “hit a button and a car comes,” but from a business standpoint, it’s a vast collection of hundreds of hyperlocal marketplaces in nearly 70 countries. Each marketplace is 2-sided, with riders and drivers, has its own network effects driven by pickup times, coverage density, and utilization.
Understanding the above has been one of my biggest lessons since joining Uber. There’s a lot of nuances in the business that come out of deeply grokking this perspective, and the run-on implications – especially the importance of drivers – are fundamental in understanding Uber and on-demand companies in general.
“More Drivers”
If I were to simplify my role at Uber, it’s pretty simple – in the diagram above, it’s figuring out how to get More Drivers. This is one of the foundational elements of Uber’s business, because as I mentioned before, the company is a collection of hundreds of local 2-sided marketplaces. And while most in the tech scene have a pretty good understanding of how you might go about getting more people to install the Uber rider app, it’s harder to imagine what it takes to get more drivers onto the Uber platform. I know I certainly didn’t know much about it before starting to work at the company!
Uber’s platform has 1M+ drivers
So let’s dive into this topic, and we’ll start with a quote about why Uber’s platform is so important for drivers, using a quote from David Plouffe, who’s on the board of Uber and also ran Obama’s 2008 campaign.
In his essay Uber and the American Worker, he writes:
The Bureau of Labor Statistics estimates that 20 million Americans are forced to work part-time for “non-economic reasons” like child care or education. And 47 percent of people in the U.S. say they would struggle to handle an unexpected $400 bill, and a third of those said they would have to borrow to pay it.
In other words, tens of millions of people in America need work. The Uber platform has a lot of drivers on the platform – over a million – and we hope to get more. That’s real scale, and something that inspires me every day. Plouffe continues in his essay with some interesting statistics:
Uber currently has 1.1 million active drivers on the platform globally. Here in the U.S., there are more than 400,000 active drivers taking at least four trips a month. Many more take only a trip or two to earn a little extra cash. It adds up: in 2015, drivers have earned over $3.5 billion. And by the way, only about 40 percent of drivers are still active a year after taking their first trip.
You can see from the above why driver growth is a key to Uber’s success – you’re convincing a ton of people to drive who have often never driven before, and many try it out and leave. Or they are part-time.
If you want to read more about drivers, their demographics, growth rate, etc., here’s a great 30-page paper called An Analysis of the Labor Market for Driver-Partners in the United States. Great reading.
Surge pricing and lowering fares: Keeping the marketplace in balance
The lens of Uber as hundreds of 2-sided local marketplaces also helps explains the importance of compromises like surge pricing and fare cuts. These mechanisms keep the marketplace in balance, and help grow the network effects that Gurley and Sacks recognize in Uber. Without them, one side of the marketplace might outstrip the other, causing a downward spiral. So even though neither side is happy with all of the marketplace balance tools that Uber puts to use, it’s ultimately a foundational tool in Uber’s business.
Take surge pricing, for instance. It’s easy to hate it, as a rider, and there are legitimate cases where it should be turned off. But think about it from the driver’s point of view- it gives them a huge incentive to get out onto the road, and to come to the exact area in the city where they are most needed. In fact, surge is done on a hyperlocal basis- just check out the screenshot of the driver/partner app to get a sense for how tightly drivers are directed to come to high-demand spots.
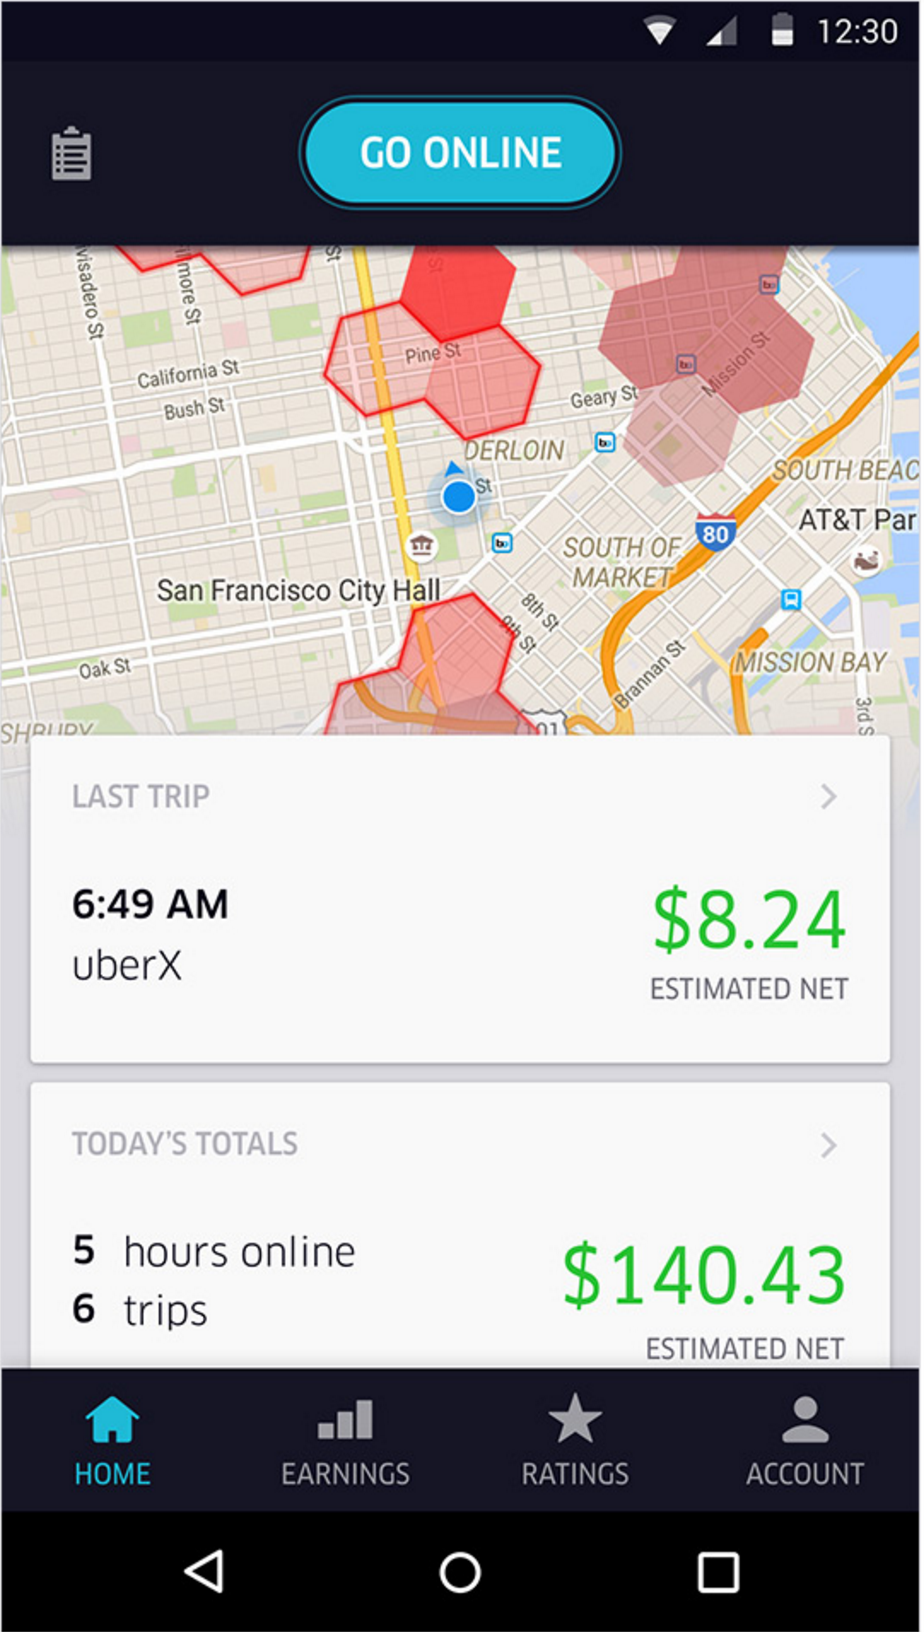
Each colored hexagon above is a different level of surge. If you want to go in-depth on surge pricing, there’s a medium-length case study here: The Effects of Uber’s Surge Pricing.
(You can see more about the driver/partner app here and a Wired article on its development).
The flip side of surge prices, which raise fares for consumers, are lowering fares. Uber has recently cut fares in about 100 markets. Like surge prices, these cuts are a marketplace balancing mechanism to increase demand and ultimately increase driver earnings.
This is done in a way described within Sack’s diagram above, where the “less downtime” arrow is the key. When drivers aren’t sitting and waiting for their next trip, they are more efficiently utilized, which increases their earnings. If you can get earnings-per-trip and trips-per-hour to go the right way, you can increase earnings-per-hour.
Uber has released some directional charts showing this as positive for drivers, as part of Price cuts for riders and guaranteed earnings for drivers. The essay describes an approach of lowering fares to boost demand, and pairing that with guarantees while the rider side of the market figures this out. In tandem, good things happen, such as these graphs of earnings in some of Uber’s largest markets:
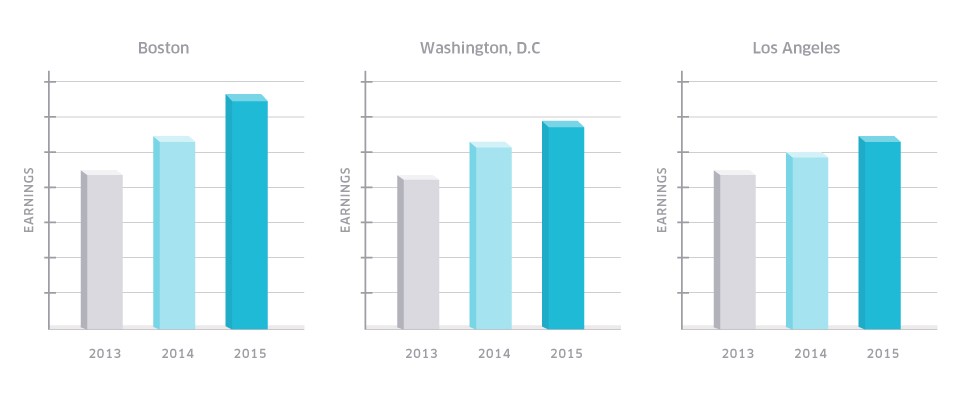
As you can see, the earnings numbers are moving up and to the right. Not bad.
In closing, a fun video
Ultimately, Uber is providing an important platform for both riders and drivers to interact, across hundreds of hyperlocal marketplaces around the world. When you start to think of it this way, and especially from the driver’s POV, rather than the rider, you’ll start to 10X your understanding of Uber’s business.
If you want to learn more about roles at Uber, here’s a link to get in touch or just look at the careers page.
And finally, I want to leave y’all with a fun video featuring Jonathan driving an Uber and singing Roses (The Chainsmokers) with his riders. Enjoy.
My top 2015 essays on Uber, online dating, push notifications, Apple Watch, and more
Good news- my vacation from writing is over!
A few months back, I joined Uber, and took time to get settled into the new role. As promised, I’m back, and will have more essays on growth, tech, and more for 2016. If you want to get my future essays via email – just fill this out:
In the meantime, below are a list of my top essays from 2015. It includes writing on a bunch of topics: Uber, Dating apps, Push notifications and retention, Apple Watch, Women in tech, and more.
Hope you enjoy them.
-Andrew
San Francisco, CA
Featured essays from 2015
The Next Feature Fallacy
“The fallacy that the next new feature will suddenly make people use your product.”
New data shows losing 80% of mobile users is normal, and why the best apps do better

This is the Product Death Cycle. Why it happens, and how to break out of it

Personal update- I’m joining Uber! Here’s why
“I’m joining Uber because it’s changing the world. It’s one of the very few companies where you can really say that, seriously and unironically.”
More essays from 2015
This is what free, ad-supported Uber rides might look like. Mockups, economics, and analysis.
The most common mistake when forecasting growth for new products (and how to fix it)
Why we should aim to build a forever company, not just a unicorn
Why investors don’t fund dating
Ten classic books that define tech
The race for Apple Watch’s killer app
Photos of the women who programmed the ENIAC, wrote the code for Apollo 11, and designed the Mac