Archive for September, 2014
Mobile retention benchmarks for 2014 vs 2013 show a 50% drop in D1 retention (Guest post)
[Andrew: There’s very little data out there on mobile, and so in the last few weeks, I’ve had guest posts on the % of users who opt-in to push notifications, as well as clickthrough rates of push. Today, I have some new metrics around retention, including for the first time, a systematic study of D1/D7/D30 retention for mobile apps. This is released by Mack Flavelle of Tapstream, who you can follow on Twitter]
Mack Flavelle, Tapstream:
As most app developers know, retaining new users is hard and some would say it gets harder every year. At Tapstream we wanted to test that notion so we looked at anonymized aggregates of attribution data collected by our platform as our customers acquire and engage their mobile users. The steep decline of engagement rates year over year was a surprise even to us.
We compared data from May 2013 to data from May 2014. To give you some context, in May 2013 an average app developer would retain about a quarter of their users a day after acquisition.
This is what keeps marketers up at nights: it means that three quarters of their acquired users didn’t stick around even for one day.
But when compared to May 2014, 25.5% retention on day one suddenly started looking very good:
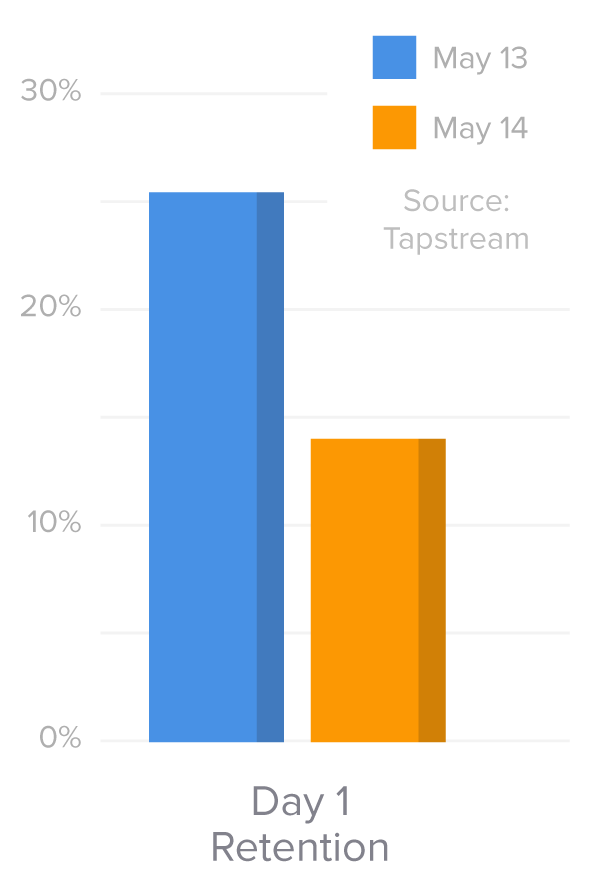
On average only 14% of users stuck around a day after downloading an app. That is less than one in seven users. Those are abysmal rates by any measure.
This is exactly why we at Tapstream created Onboarding Links: to engage new users the moment they run the app for the first time. Reducing the app abandonment rates is becoming a crucial part of user acquisition.
Beyond day one
Another dimension of this data is looking further down the funnel to see how user retention fared at day 7 and day 30 after acquisition.
Again, the results are not encouraging:
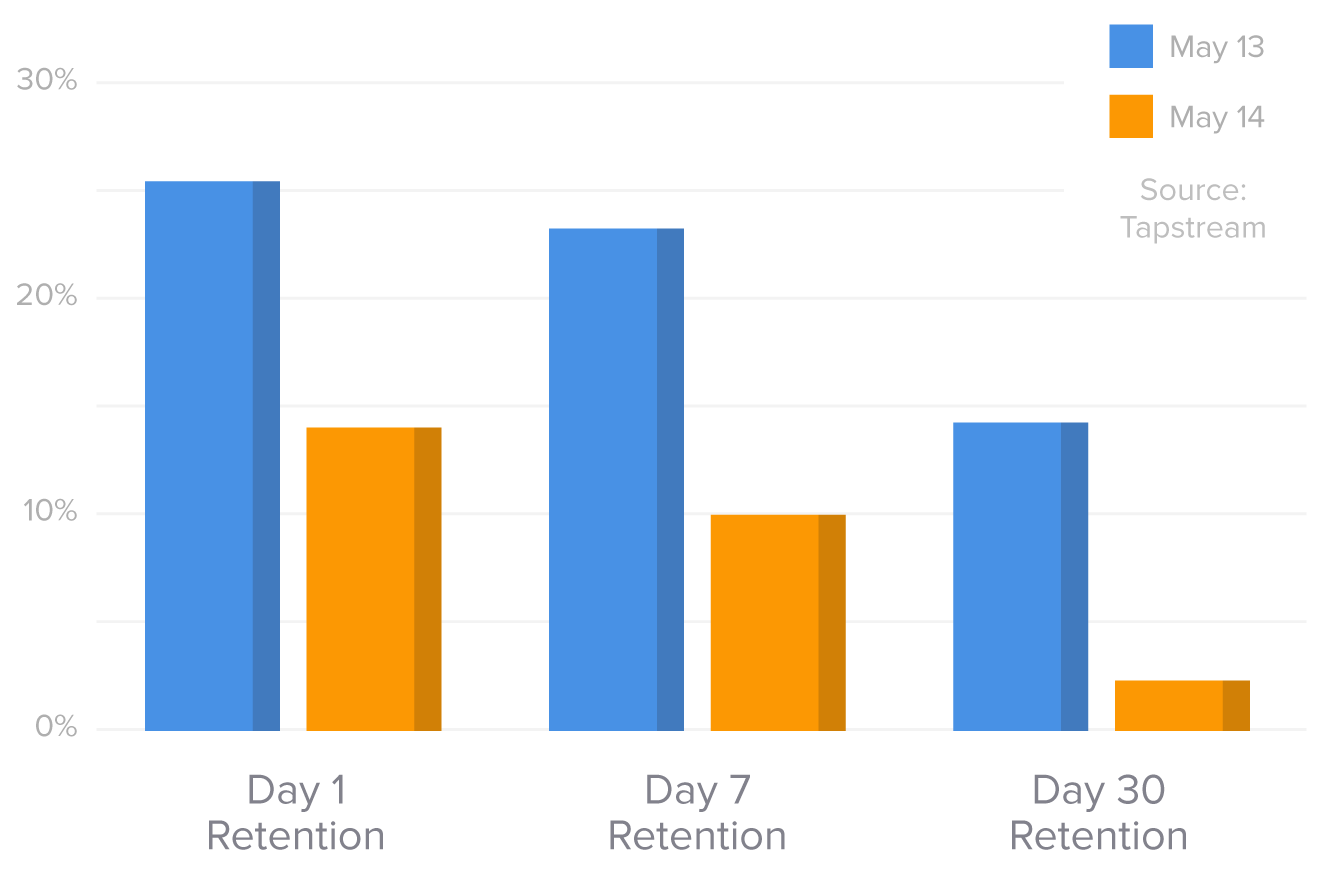
Day 7 retention went from a respectable 23% to a measly 10% in May 2014, while Day 30 retention plummeted from 14% to 2.3% – a full 84% decrease.
To put this into perspective, the average next-day retention rate in May 2014 is almost the same (14.06%) as Day 30 retention rate a year ago (14.30%).
The story behind the numbers
What’s causing this dynamic to play out in the mobile app ecosystem is up for debate, but here are the most obvious culprits for why user retention in mobile has dropped 50% in the last year:
Incredibly low barrier to entry so no sunk cost loyalty
It takes about 10 seconds, a smattering of taps and usually zero dollars before a consumer is the proud new owner of your app. But easy come, easy go – there’s usually so little investment in your app there’s no pain of switching. As table stakes for app design get raised (remember when every app used default nave elements and controller views?) the next shiny thing to come along and grab consumer attention really is very shiny.
Incredibly low barrier to entry so no filter on user quality
When you have an expensive product and somebody buys it you can generally assume they did some research beforehand and had an idea of what they were getting into. They essentially self-filter to be loyal users by the time they engage with the product. With apps any such assumptions are out the window – there is nearly zero intent signalling by the consumer, even after they have “purchased” your app.
Disconnect between time of download and first open
There’s often a lack of context when a new user opens an app. This isn’t Christmas morning, unwrapping the box hoping for an NES. Between the moment somebody absent-mindedly downloads your app and opens it for the first time they’ve probably checked Facebook six times, Twitter three, bid on two obscure statues on Ebay and attended a funeral. The likelihood of them remembering the emotional switch that got them to download is reasonably slim.
Forklifting apps and other bad initial experiences
One of the tricks du jour, championed by the Japanese card games and the genre they inspired, is forklifting content into the app on first open. Sure the app itself is tiny, you don’t even need WiFi to get it, but then there’s a six-minute load time the first time you open it. This and other terrible first-run experiences can lead to serious drop off.
None of those explain the drastic decrease in retention over the last year. That may be a byproduct of the explosion in available apps. In fact most people would assume so, considering the huge number of apps available today.
The problem with that theory is that in May of 2013 nobody said
“I really wish there were more than half a million apps available, because I would definitely download and use more”
Arguably the variety of supply already far outstripped the demand.
So the relevant info becomes how many apps are being downloaded per device in May 2013 versus a year later. Are people downloading more apps and that’s why they’re not sticking around, or are they downloading better apps which is why they’re not sticking around?
Lucky for us one of the smartest minds in mobile started looking at that last year.
“Finally, these numbers are accelerating. Apple did 5bn downloads in the three months from December 2012 to March 2013, and then another 5bn from March to 15 May. The lack of precision means we can’t say this was double the rate, but the trend is clear, and it looks the same at Android…”
– Benedict Evans, from his blog.
Assuming Ben is right (and he often is) we can infer a gentle increase in the number of apps downloaded per phone, coupled with a higher quality of apps across the board has meant that the competition in the app store has become more fierce not only in terms of number of animals in the jungle but also the ferocity of those animals. Both of these factors end up driving down user retention in mobile apps versus a year ago.
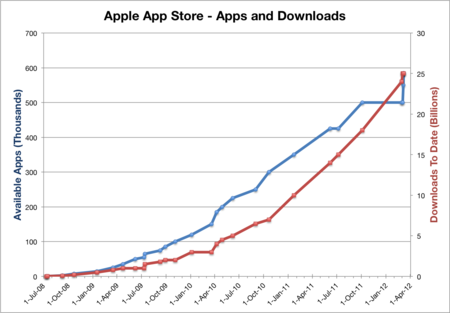
source: http://en.wikipedia.org/wiki/App_Store_(iOS)
Though this chart ends in 2012 and is iOS-specific we know that the trend continues but only steeper across both ecosystems as seen here and here.
About data used to generate this report:
Data was collected by Tapstream for months of May 2013 and May 2014 from over 100M devices. It is anonymized and it includes both iOS and Android apps, spanning many verticals from gaming to travel. The data excludes apps with DAUs of over 1M.
New data on push notifications show up to 40% CTRs, the best perform 4X better than the worst (Guest post)
[Andrew: A few weeks ago, the folks at Kahuna released some great data showing that up to 60% of users opt-out of push notifications. Now they’re releasing some new data on the click-through rates of push notifications, showing the differences between app categories and breaking down the reasons why some apps are so much stronger than others. They were gracious enough to share this data for the first time, as a guest post on here – you can get in touch with the author, Alli Brian or Adam Marchick, Kahuna’s CEO.]
Push notification click-through rates via Alli Brian @ Kahuna
The best apps know how to use push notifications to their advantage. They’ve figure out how to make their service part of their users’ daily routine, and they leverage push as a vehicle to do this.
Recent data from Kahuna reveals that push engagement rates vary widely across industries – utility and financial services apps seeing the highest performance, and retail and social experiencing the worst. Here’s a comprehensive look at the state of push engagement rates, as well as a roadmap for getting back on track if your app is trailing behind.
Here’s the data:
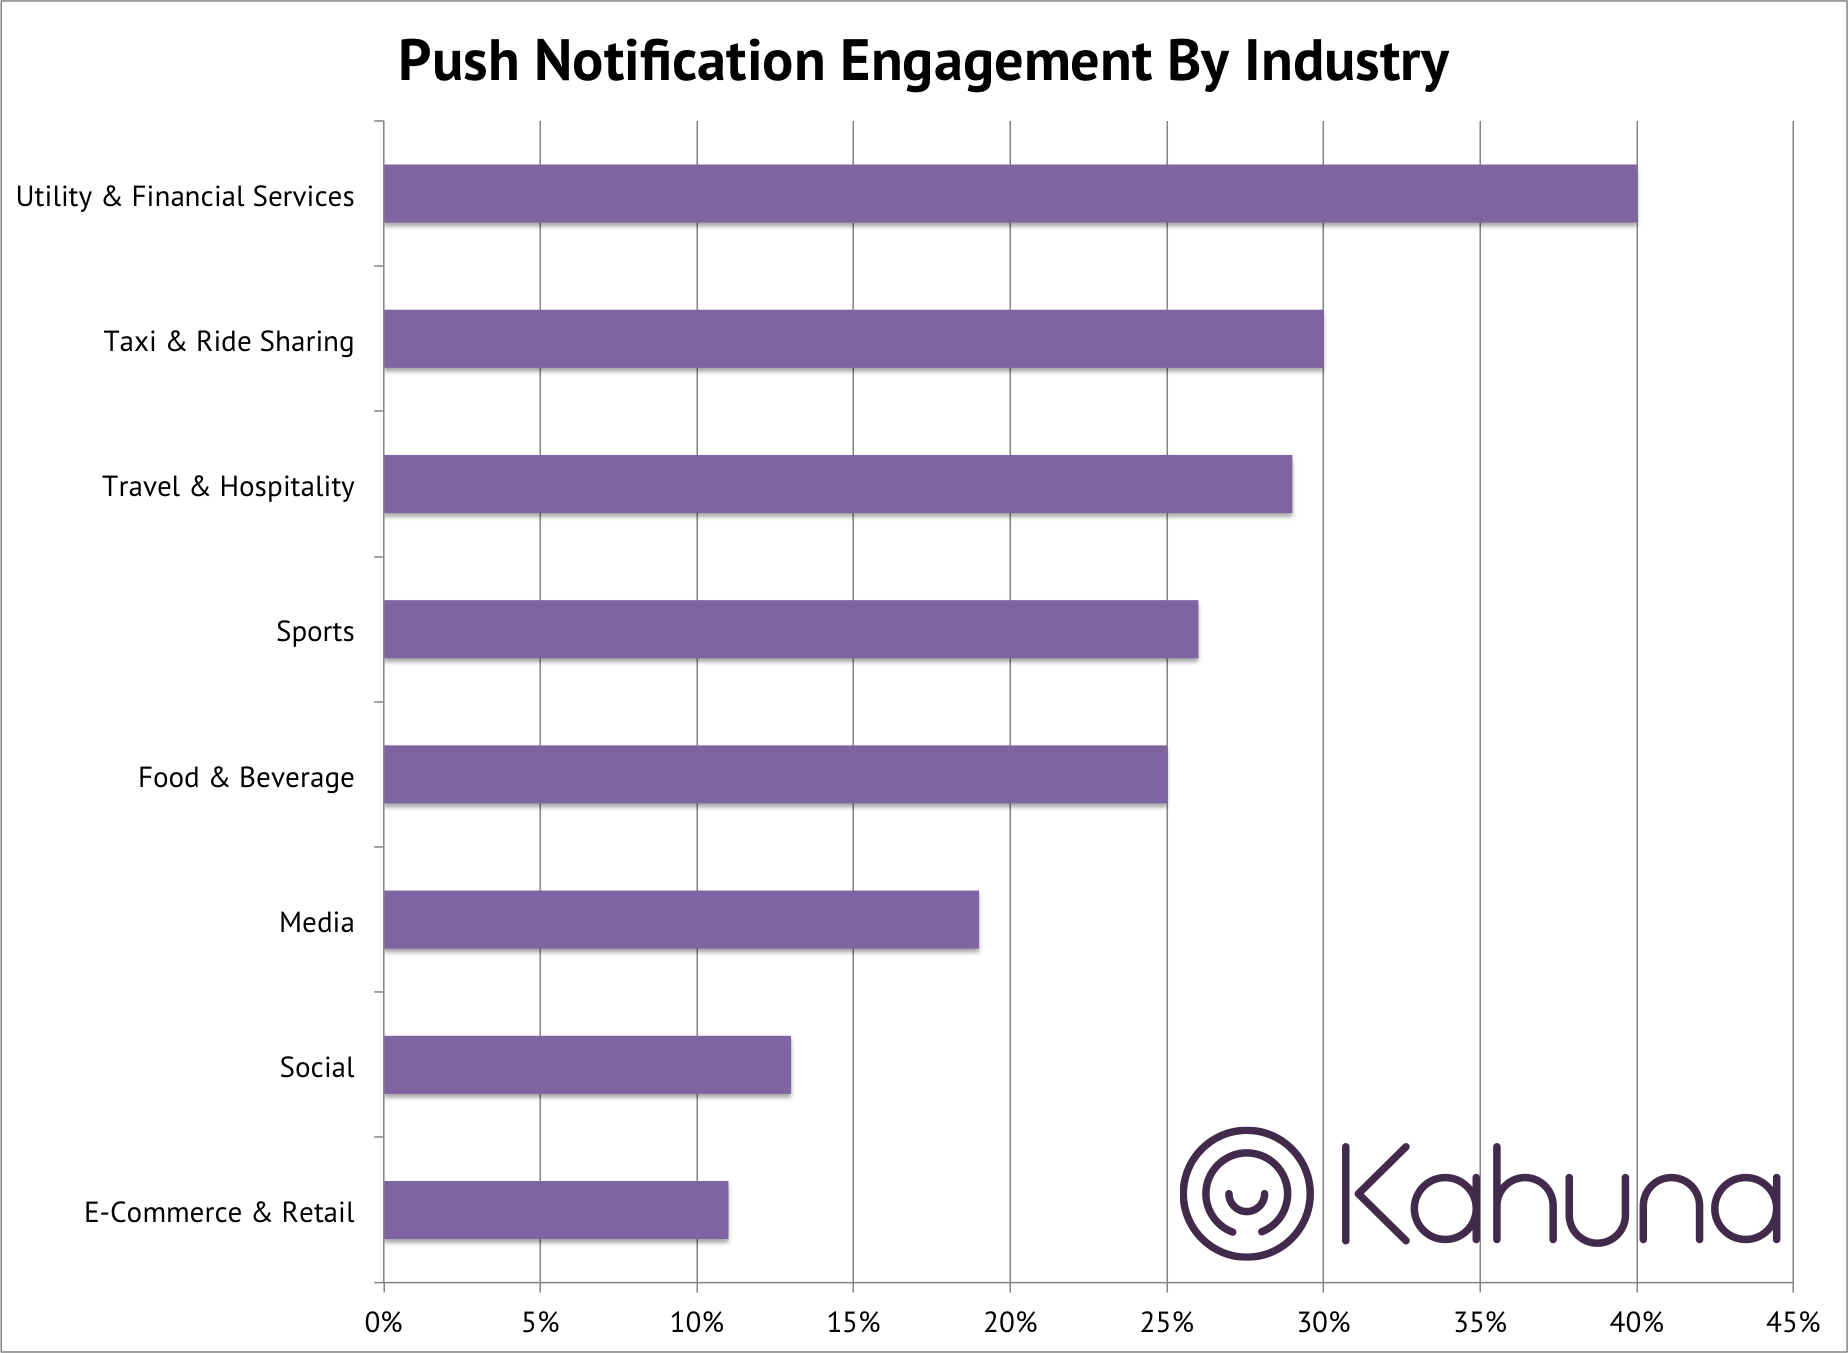
You can see that push engagement rates for utility and financial services notifications (40%) are nearly four times higher than for e-commerce & retail notifications (12%). While all industry notifications benefit from significantly higher engagement rate than they see from traditional email engagement, the wide discrepancy can result in significant revenue loss for underperforming apps.
Get new updates, usually once a week – featuring long-form essays with what’s going on in tech.
Apps That Are Winning
High push notification engagement rates are most often seen by apps with high frequency users. These apps use notifications to nudge their users do something that has become part of their regular routines. Utility, Financial Services and Ride Sharing apps lead the way – think about how normal it is to make these apps part of your daily or weekly routine. Looking for directions, watching your budget and taking a taxi are very regular activities, and using push to incentivize these actions is extremely effective. Here are a few examples:
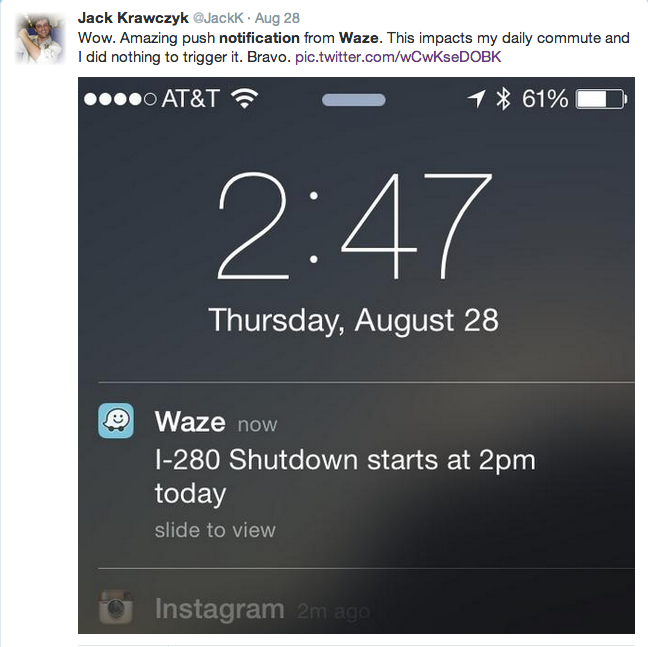
Utility apps have an obvious job to do – know your users daily routines and help them out when they appear to be getting into trouble. That’s what this push notification from Waze did – it was sent to Waze users folks who regularly take the 280 freeway from San Francisco to Silicon Valley. And Waze users appreciated the heads up. Other high performing notifications from utility apps like job search or apartment rental services include new job listings or apartment availability alerts.
User engagement with these notifications (when appropriately timed) can be off the charts – as high as 80%.
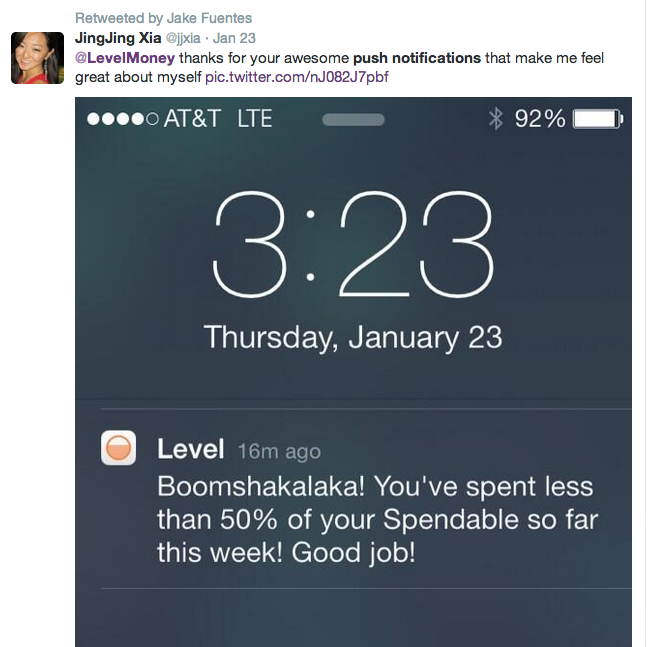
Financial services apps also experience strong push engagement. By nature of the industry, money management is an important part of our daily lives. Hold the purse strings (or send a notification about them) and your users will be quick to respond. Take a look at this notification from Level Money. Their push engagement is off the chart.
But What If You’re Having A Harder Time Of It?
If you are in an industry that suffers from low push engagement rates, how do you overcome this? Retail, social and media apps typically have a more difficult time creating push notifications in a way that provides real user value. The good news: research shows that you can influence push engagement rates by using strategies that motivate users to integrate your app into their regular routines. Here are the top three techniques that will improve your notification response rates.
1. Find your Cadence:
Notification tolerance varies across app industries and individual users, so make the most of your notifications. Not all apps should be sending push notifications once a day, and engaged users have a vastly different tolerance for notifications than do new users or dormant users. Rather, it’s about sending the right message to the right person at the right time. In many cases, the elegance is in knowing when not to send a message. Check out the example below.
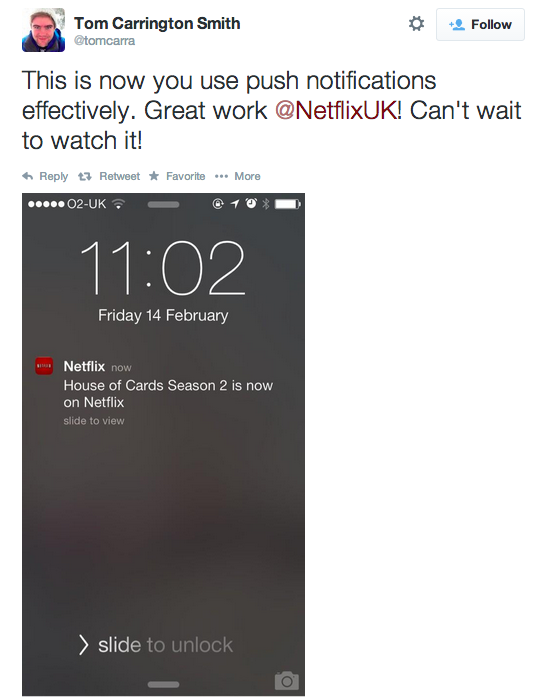
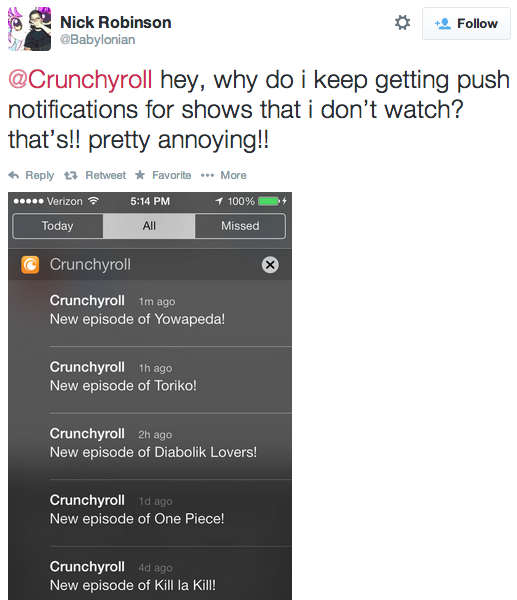
Netflix does a great job of personalizing their notifications to the individual receiving them. Every user receives a unique message about the specific show they have been watching. Rather than sending every user a notification every time a new episode of any show is released, consider one perfectly personalized notification. Crunchyroll could take a page out of their book.
Note: Sophisticated automation that limits and prioritizes the number of pushes each user is eligible to receive is the best way to achieve the appropriate cadence, given the numerous corner cases.
2. Make it personal
Don’t assume every user wants to hear about the same thing. Sending a notification that is valuable to the user isn’t just about a 10% coupon – it’s about presenting a relevant offer. The most compelling offer is one that contains information that the user deems important. Check out reactions to the notifications below.
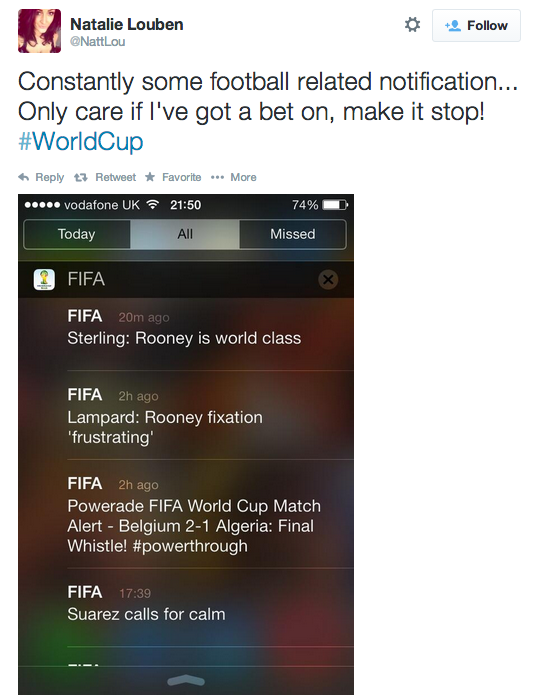
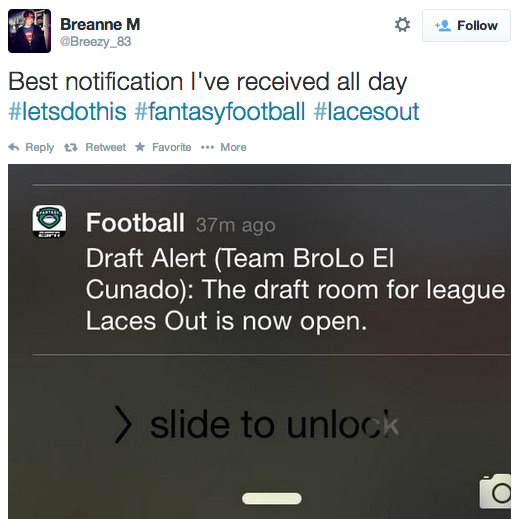
These notifications both came from sports apps but elicited very different user responses. The FIFA notification about the world cup was perceived as spam – simply because the app users to which it was sent was uninterested in the particular game mentioned in the message. In contract, the notification from SportsCenter that referenced the user’s specific fantasy football league was perceived as delightful content.
Worst of all is the mis-personalized push notification. We can’t emphasize enough how critical it is to gather accurate, person-level data to inform your notification. Use a unique identifier so even anonymous users will get accurately personalized notifications. Check out what happens if you send notifications to “devices”, not people.
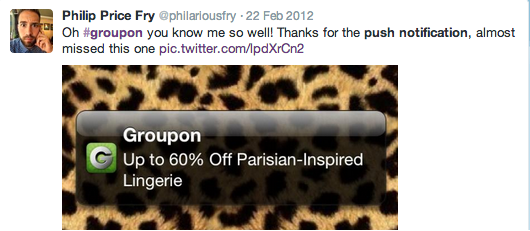
As you can see above, device-based tracking does more harm than good. For example, if your wife borrows your phone and does a bit of browsing, all of a sudden you’ll be receiving notifications about irrelevant flash sales.
3. Timing is everything
Great timing should consider both user behavior and urgency. Notifications that include urgent information need to be sent at a time that is relevant to the context of the message, such as the notifications below.
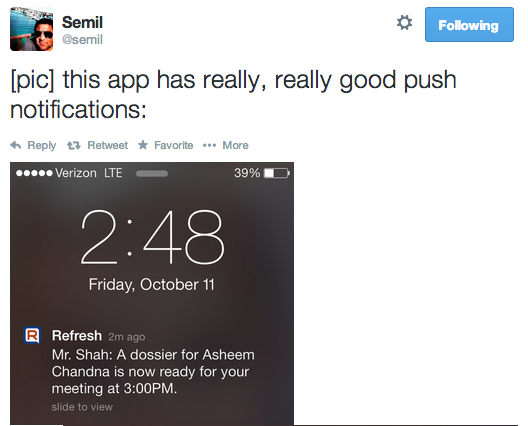
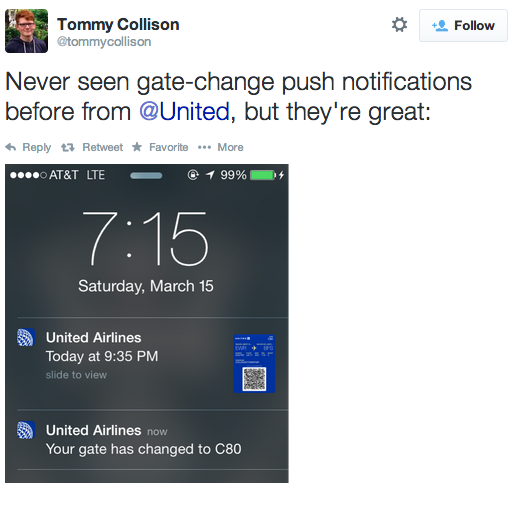
As you can see, the notifications sent by Refresh and United Airlines both reference urgent and important information, and are tailored to the specific person receiving the message. As such, the response to the notifications are very positive.
For notifications that are not critically urgent, the goal is to minimize disruption and maximize delight. The horror stories about waking up to a mis-timed push notification abound, and users are not forgiving (see below).
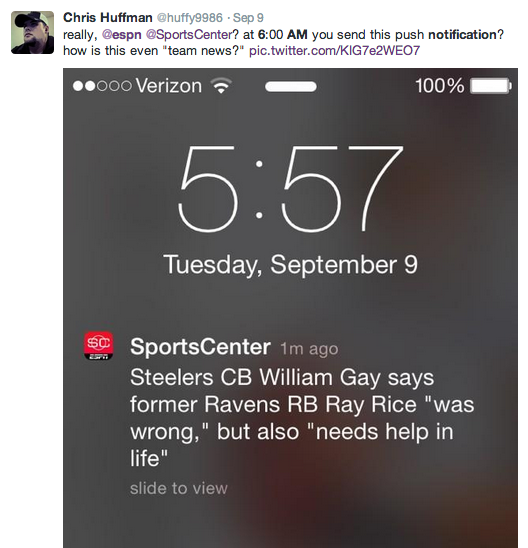
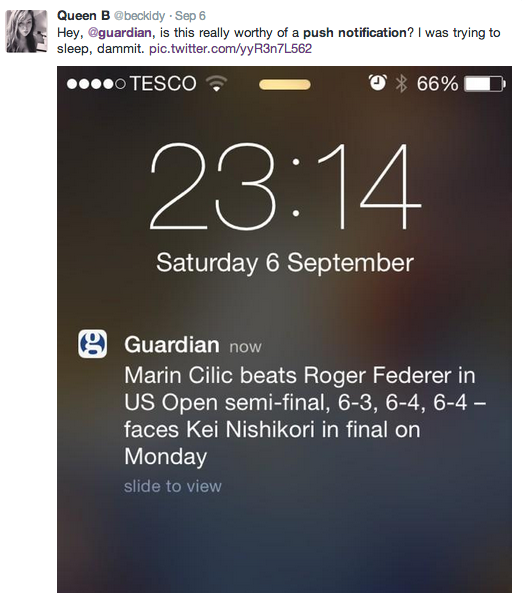
Considering every user keeps a different schedule, the only solution is to send push notifications at the time when each user is most likely to engage with your app. Kahuna data reveals that customizing delivery time based on user preference results in an average conversion uplift of 384%.
Great push is all about inspiring delight – facilitating a relevant and valuable app experience for your users and securing a prized place in their daily routines. Whether you’re in a high-performing industry like Utility or Financial Services or a low-performing one like Retail or Social, there is always room for improvement. Focus on understanding what your users value about your service and tailor your messages to their unique needs and interests. You’ll see push engagement skyrocket, and your users transform into rabid advocates.